Understanding the difference between data vs information is fundamental for any organization aiming to build a coherent content strategy. While these terms are frequently used interchangeably in casual conversation, they represent distinct stages in the lifecycle of business intelligence. At its core, data is the raw material of your digital ecosystem, while information is the refined output that guides your decision-making processes. Recognizing this distinction is not merely an academic exercise; it is a practical necessity for leaders who want to move beyond guesswork and toward evidence-based strategy.

Data is defined as raw, unorganized facts, statistics, or observations collected for reference or analysis. In a business setting, this might include individual website clicks, specific customer purchase timestamps, or raw survey responses. Because data lacks intrinsic context, it remains largely inert on its own; it exists as a series of isolated points waiting for a framework. You can store this data in databases or CRM systems, but until it is processed, it does not tell a story or reveal a trend. It is simply a record of what happened, without explanation of why it happened or what it means for your future actions.

Information is data that has been processed, structured, and interpreted to provide meaning and context. When you take those thousands of raw website visits and organize them by referral source or landing page performance, you have transitioned from data to information. This transformation is what allows stakeholders to move from observing facts to identifying actionable insights. If data is the foundation of your digital presence, information is the map that helps you navigate it. It answers the critical questions of “so what?” and “now what?” that raw numbers cannot address on their own.
Distinguishing Qualitative and Quantitative Data
To manage your internal resources effectively, you must distinguish between the two primary forms of data. Understanding these categories ensures that you select the right metrics when evaluating your brand’s performance in generative search or traditional web environments. Each type serves a unique purpose in the analytical process, and relying too heavily on one while ignoring the other can lead to skewed conclusions and missed opportunities.
The Role of Quantitative Metrics
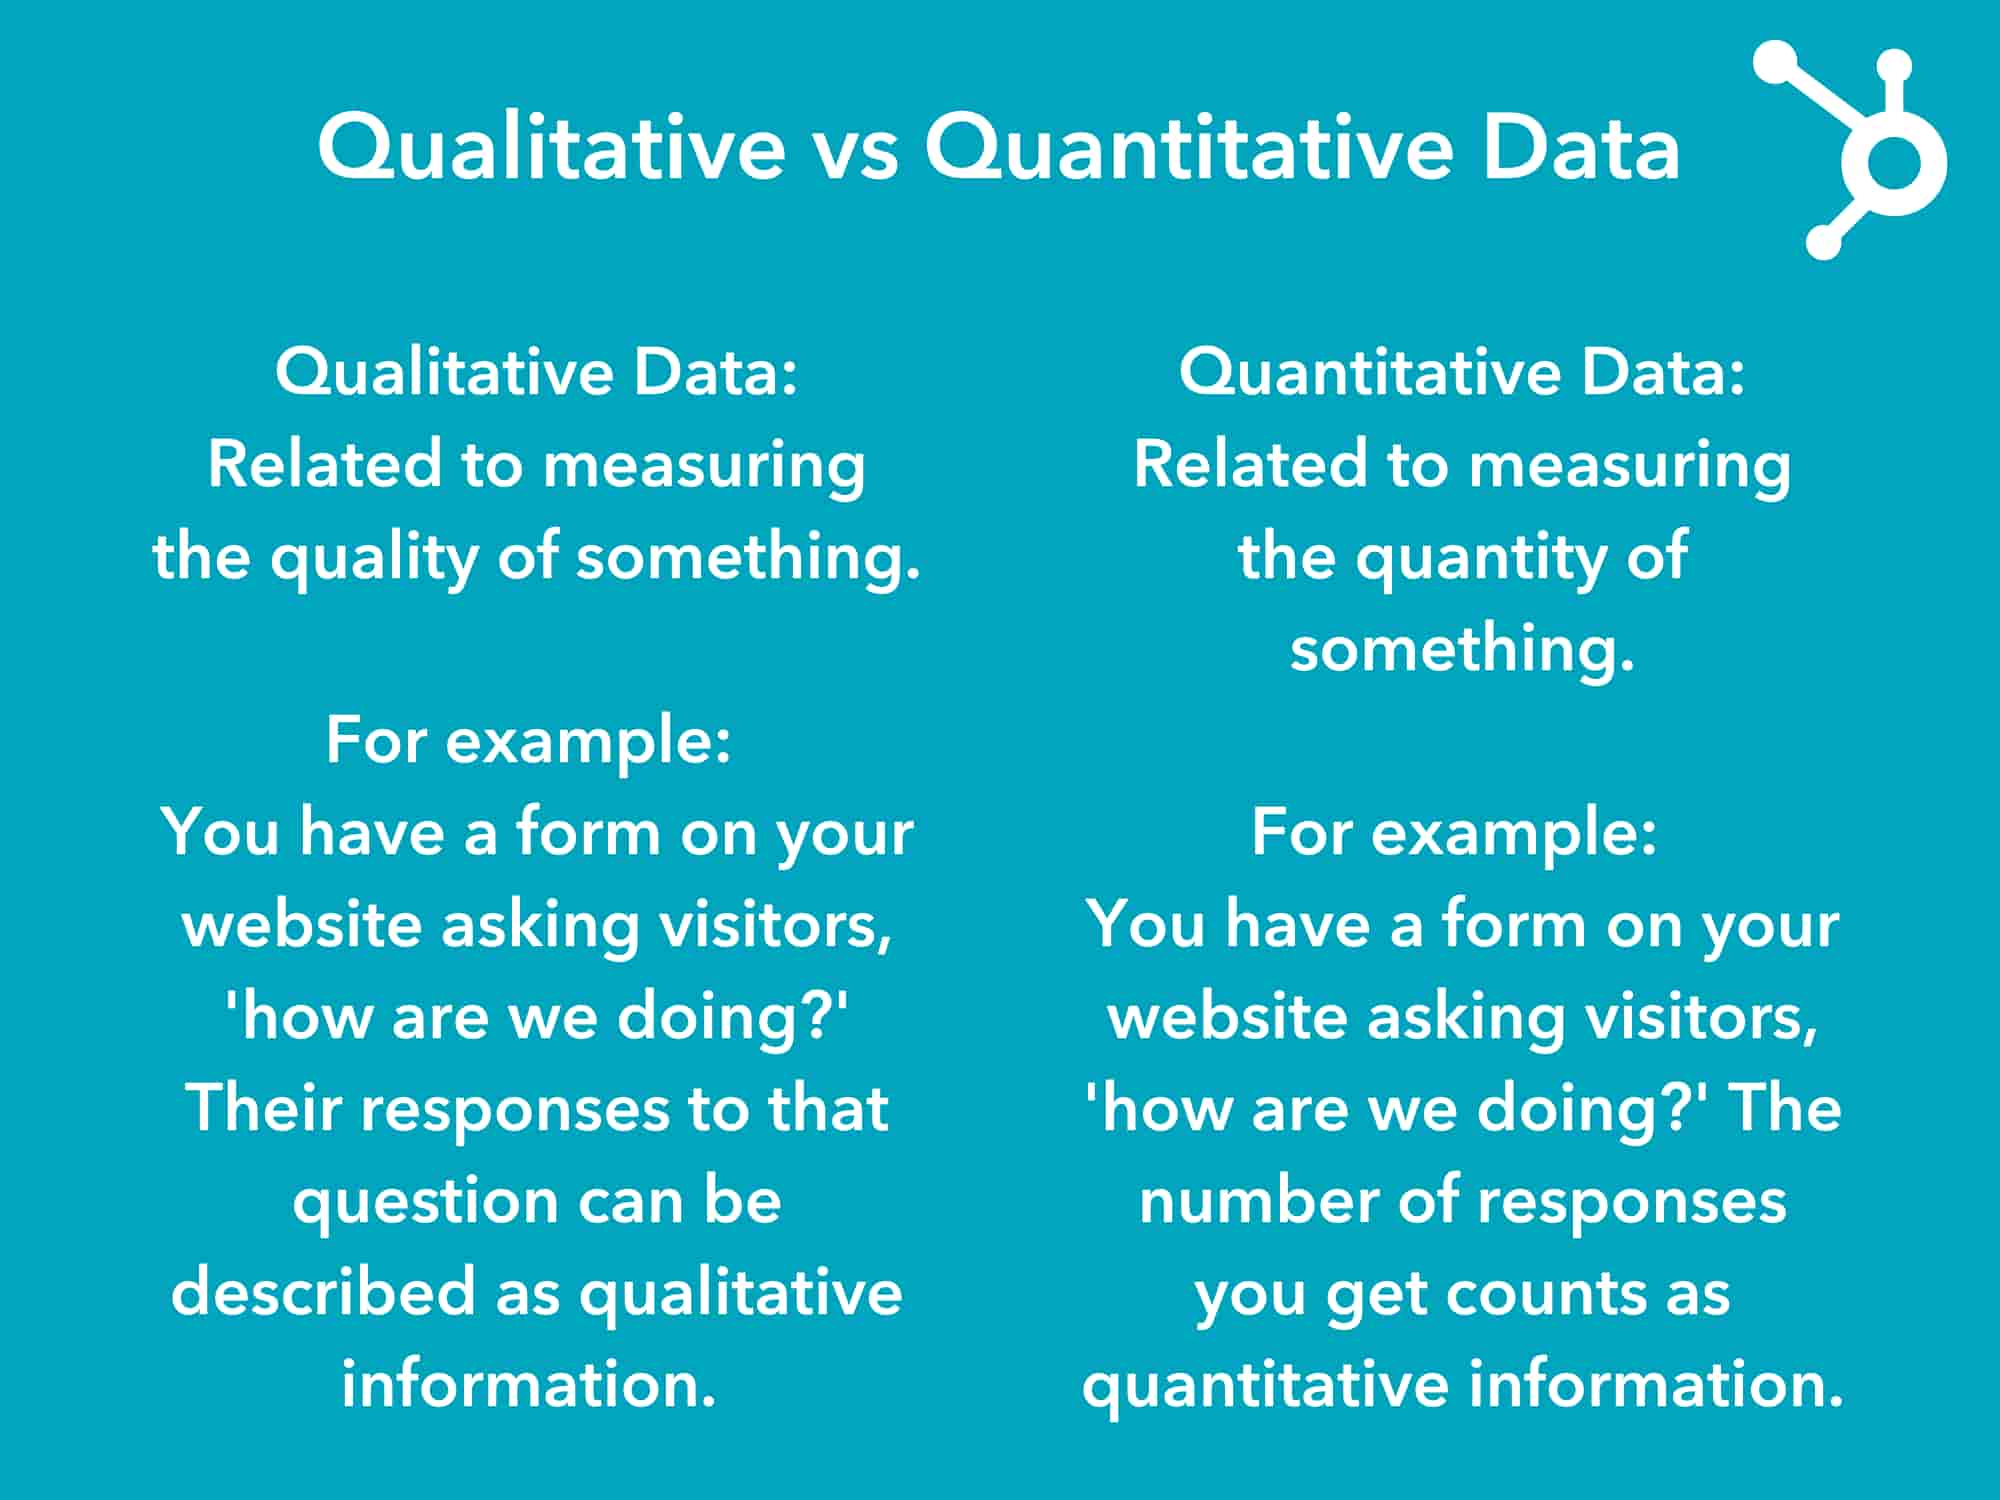
Quantitative data refers to information that can be measured numerically. This includes metrics like page views, bounce rates, or the number of inquiries received through a contact form. It provides the ‘how much’ or ‘how many’ of your business operations. Because this data is inherently structured, it is often the first to be integrated into reporting dashboards. It allows for easy comparison over time and across different segments of your audience. For instance, tracking the exact number of downloads for a whitepaper gives you a clear, objective measure of interest. However, quantitative data alone cannot explain the motivations behind those downloads. It tells you that interest exists, but not why it exists.
The Value of Qualitative Insights
Qualitative data focuses on the quality or characteristics of a subject. This is often gathered through open-ended survey responses, customer feedback, or sentiment analysis. While harder to quantify, this data provides the ‘why’ behind the numbers. It captures the nuances of human behavior, emotion, and preference that numbers often miss. For example, a drop in sales (quantitative) might be explained by customer complaints about a new checkout process (qualitative). Combining both types of data is essential for a holistic view of how your brand is perceived in the market. Without qualitative context, quantitative trends can be misinterpreted, leading to strategies that address symptoms rather than root causes.
The Transformation Process
Data becomes information through a rigorous cycle of processing, interpretation, and organization. Raw statistics do not speak for themselves; they require context to become useful in a business environment. Without this interpretive layer, you are simply looking at noise rather than signals. This transformation is the heart of effective data management, turning a chaotic collection of facts into a structured narrative that drives strategy.
Processing and Organization
Processing involves the initial collection and storage of raw facts. Whether you are capturing data from your website or user interactions, this step requires standardization. If your data is siloed in disparate applications, it is difficult to synthesize. Centralizing your data in a single source of truth allows for the consistent application of logic across your entire organization. This stage also involves cleaning the data—removing duplicates, correcting errors, and filling in missing values. Poorly processed data leads to misleading information, a concept often referred to as “garbage in, garbage out.” Therefore, the integrity of your information is directly tied to the rigor of your initial processing steps.
Contextual Interpretation
Interpretation is the act of applying purpose to your data. This is where you connect your business goals to the metrics you have collected. For example, knowing that your organic traffic has increased by 10% is data; understanding that this increase correlates with a recent shift toward AI-optimized content is information. This distinction is critical for decision-makers who need to understand the impact of their strategies. Interpretation requires domain expertise and a clear understanding of your business objectives. It involves asking critical questions: Is this trend significant? Is it sustainable? How does it compare to industry benchmarks? By answering these questions, you transform static numbers into dynamic insights that can guide future actions.
Defining Data vs Information in Practice
To clarify how these concepts differ, consider the following points of comparison:
| Feature | Data | Information |
|---|---|---|
| Nature | Raw facts and statistics | Processed and contextualized |
| Utility | Unorganized and lacks meaning | Organized and actionable |
| Dependence | Independent entity | Dependent on data |
| Format | Often numeric | Often descriptive or textual |
| Goal | Used for reference | Used for decision-making |
Data is a group of facts or statistics, whereas information offers context. Your information depends on your data, but not vice versa. Organization is key to information; data is unorganized. Data doesn’t inherently have meaning. Only when it’s analyzed does it offer purpose—and become information. Data doesn’t offer a clear enough picture to make decisions, but because it has context, information does. This relationship is hierarchical: data is the input, and information is the output. Understanding this hierarchy helps teams allocate resources correctly, ensuring that they invest in both collection (data) and analysis (information).
Common Misconceptions in Business
A common mistake in business intelligence is assuming that more data automatically equals better information. Organizations often hoard data without a clear plan for how it will be processed or interpreted. This leads to data fatigue, where teams are overwhelmed by volume but starved for insight. Another misconception is that information is static. In reality, information is dynamic and changes as new data is added or as business contexts shift. A report that was accurate last month may be obsolete today if the market conditions have changed. Recognizing these misconceptions helps leaders build more agile and responsive analytical frameworks.
Best Practices for Data Quality
High-quality information is only possible if the underlying data is reliable. If you are basing your business decisions on flawed or outdated metrics, your strategy will inevitably suffer. Maintaining the integrity of your data lifecycle is a continuous operational requirement. It involves proactive measures to prevent errors and reactive measures to correct them when they occur.
Standardizing Data Collection
Standardization is the most effective way to ensure data consistency. By using uniform formats for data entry and collection across all channels, you reduce the risk of errors. This includes cleaning out old or irrelevant records that no longer represent your current customer base or market reality. Regular audits of your data sources will help you maintain a clean and usable database. Standardization also extends to definitions: ensuring that every department uses the same definition for key metrics like “conversion” or “active user.” Without aligned definitions, data from different teams cannot be reliably combined, leading to fragmented and confusing information.
Integrating Data Sources
Data silos are the enemy of effective information management. When your marketing tools, CRM, and analytics platforms are not synced, you lose the ability to see the full picture. Integrating these platforms allows you to create a seamless flow of information. When applications communicate, you can generate reports that provide a comprehensive view of your brand’s performance rather than isolated snapshots. Integration also enables automation, reducing the manual effort required to compile data and minimizing the risk of human error. By breaking down silos, organizations can create a unified view of their customers and operations, leading to more coherent and impactful business intelligence.
Examples in a Business Context
Seeing the difference in a practical setting helps ground these abstract concepts. Consider how these examples manifest in your daily operations:
- Data: A list of 500 individual purchase timestamps from your website.
- Information: A report identifying that 70% of your transactions occur between 6:00 PM and 9:00 PM.
- Data: The number of sessions on a specific landing page.
- Information: The insight that users on this landing page are 20% more likely to convert when they arrive via organic search.
These examples illustrate the value add of processing. The raw data points are useful for record-keeping, but the information derived from them is useful for strategy. In the first example, knowing the peak transaction times allows you to schedule customer support staff or run targeted promotions during those hours. In the second example, understanding the higher conversion rate from organic search might lead you to invest more in SEO efforts for that specific landing page.
Strategic Implications for Leadership
For leadership teams, the ability to distinguish between data and information is crucial for resource allocation. If you are spending most of your budget on data collection but little on analysis, you are building a library without a librarian. Conversely, if you are trying to analyze poor-quality data, you are building a house on sand. Effective leaders ensure that their teams have the tools and training to transform data into information. This includes investing in the right technology for data management and fostering a culture that values evidence-based decision-making. By prioritizing this transformation, organizations can stay ahead of competitors who are still stuck in the era of raw data hoarding.
By focusing on the journey from raw data to actionable information, you can avoid relying on intuition alone. Instead, you build a business strategy supported by evidence. This approach is particularly relevant in the era of generative search, where the quality of your underlying content and data directly influences how your brand appears in AI-driven answers. When you prioritize the quality of your data, you are essentially setting the stage for more accurate and visible information, ensuring your brand remains competitive in an increasingly automated landscape.
Ultimately, the goal is not just to collect as much data as possible, but to cultivate the ability to translate that data into meaningful information. How does your current data management strategy support the transition from raw metrics to strategic insights?


