When you are building a product, your initial focus is often on quality, testing, and finding a market fit. During these early stages, financial tracking usually takes a backseat to development. The primary goal is to validate the concept and ensure that the product solves a genuine problem for your target audience. However, as your product gains traction and starts generating consistent revenue, you need a clearer understanding of your unit-level profitability. This is where contribution margin becomes an essential metric for your financial toolkit.

Contribution margin is the amount that your revenue from one sale exceeds the costs you paid to develop that specific unit. These are your variable costs, which fluctuate depending on your production volume. If you spend $50 to produce one unit and sell it for $75, your contribution margin is $25. This metric helps you understand the direct financial impact of each sale without the interference of fixed overhead costs like office rent or administrative salaries.
By isolating variable costs, you gain a sharper view of how individual products contribute to your company’s financial health. It provides a more precise look at pricing and production efficiency than a standard profit margin, which blends all types of expenses together. For instance, a software company might see cloud storage costs as a variable expense, while its corporate office lease remains a fixed cost regardless of how many new users join the platform. Distinguishing between these categories is vital for accurate decision-making. Understanding this distinction allows founders and managers to separate the noise of operational overhead from the signal of product performance.
Calculating Contribution Margin for Strategic Growth
To find your contribution margin, use this formula: subtract the variable cost to make one unit from the revenue generated by that same unit. This simple calculation provides a foundation for assessing your product portfolio and determining which offerings are truly sustainable. When you monitor this figure, you can identify which products provide the most value relative to the resources required to create them. This calculation is not just a one-time exercise; it should be a regular part of your financial review process.
It is important to remember that contribution margin is not the same as total profit. Because it ignores fixed costs, it represents only the surplus available to cover those fixed expenses and eventually contribute to your bottom line. If your contribution margin is low, even high sales volume might not be enough to sustain the business if your fixed costs are substantial. This is why many growth-focused businesses prioritize increasing this margin through better production processes or strategic pricing. A high sales volume with a negative or negligible contribution margin is a dangerous trap that can lead to rapid cash flow depletion.
The Critical Difference Between Margin and Profit
Many entrepreneurs confuse contribution margin with net profit margin, leading to flawed strategic decisions. Net profit margin considers every expense on the income statement, including taxes, interest, and depreciation. Contribution margin, however, stops at variable costs. This distinction is crucial because fixed costs do not change with the number of units sold in the short term. Therefore, contribution margin tells you how much cash is generated by each additional sale to help pay down those static bills.
For example, if you have a fixed monthly cost of $10,000 for rent and salaries, and your contribution margin per unit is $25, you need to sell exactly 400 units to break even. Any sale beyond that point contributes directly to your profit. If you mistakenly look only at net profit, you might miss the fact that a specific product line is actually losing money on a per-unit basis, dragging down the entire company’s performance. By focusing on contribution margin, you can pinpoint exactly which products are carrying the weight of your fixed overhead.
Why Variable Costs Matter
Variable costs are expenses that shift in direct proportion to your production volume. Common examples include raw materials, direct labor, and shipping fees. When you analyze these costs, you are looking at the direct investment required to bring one unit of value to your customer. If your variable costs are too high, your contribution margin shrinks, leaving less room for the business to absorb fixed costs and generate profit.
Managing these costs effectively requires a deep understanding of your supply chain and operational efficiency. By reducing the cost of materials or improving production speed, you directly improve your contribution margin. This creates a stronger financial position, allowing you to invest more in product development or marketing efforts without needing to increase your retail price significantly. In digital businesses, variable costs might include payment processing fees, customer support hours per ticket, or server bandwidth. Identifying these hidden variable costs is often the key to unlocking higher margins.
Assessing Performance with Contribution Margin Ratio
As your business expands, looking at dollar amounts alone might not tell the whole story. The contribution margin ratio is a percentage that represents the portion of total sales revenue that remains after deducting variable costs. This ratio is particularly useful when comparing the profitability of different products that have varying price points and cost structures. It normalizes the data, allowing for apples-to-apples comparisons across your entire product line.
The formula for the contribution margin ratio is total sales revenue minus variable costs, divided by total sales revenue. This percentage tells you what fraction of every dollar earned is contributing to your fixed costs and overall profit. It is an effective way to normalize performance metrics, allowing you to compare a low-cost, high-volume product against a premium, low-volume offering. This metric is especially powerful for businesses with multiple service tiers or product bundles.
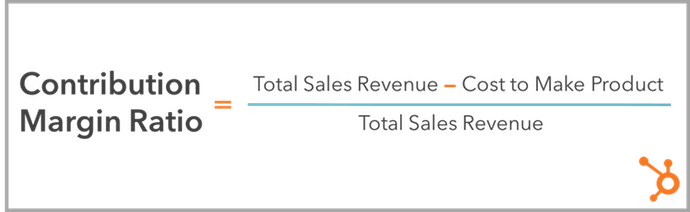
This ratio illustrates that a higher revenue product is not always more profitable. For example, if product A sells for $75 with a $25 contribution margin, its ratio is 33.3%. If product B sells for $150 with a $40 contribution margin, it brings in more total dollars, but its ratio is only 26.7%. In this scenario, product A is actually more efficient at generating profit from every dollar of revenue. This insight can drastically change how you allocate marketing spend, ensuring you are driving traffic toward the most profitable items rather than just the most expensive ones.
Common Pitfalls in Pricing and Strategy
One common mistake is attempting to adjust profitability through accounting changes alone. While managing your books is necessary, true improvements in contribution margin often come from market-driven insights. Before you change your pricing, take the time to investigate what your audience values. You might find that your customers are willing to pay for features or services that are relatively inexpensive for you to provide. Ignoring customer perception in favor of pure cost-cutting can damage brand loyalty and long-term retention.
Focusing exclusively on internal metrics without considering the customer experience can lead to missed opportunities. When you align your product development with actual user needs, you often find ways to increase the perceived value of your offerings. This approach allows you to command better prices and improve your margins naturally, rather than relying on forced price hikes that could alienate your existing user base. Another pitfall is failing to update variable cost assumptions as the business scales. As volume increases, you may negotiate better rates with suppliers, which should be reflected in your margin calculations to avoid underestimating your profitability.
Practical Steps to Improve Margins
- Audit your current variable costs to ensure you are accounting for every expense tied to production. This includes often-overlooked items like transaction fees, packaging materials, and direct customer support time.
- Calculate the contribution margin ratio for each of your primary products or services to identify your most efficient earners. Use this data to prioritize your sales and marketing efforts.
- Segment your offerings based on their ratio to determine where you should focus your marketing and development energy. Consider discontinuing or repositioning products with consistently low or negative margins.
- Engage with your customer base to understand which features drive the most value, potentially allowing for premium pricing on high-margin items. Conduct surveys or interviews to uncover willingness-to-pay thresholds.
- Review your supply chain or service delivery model to see if variable costs can be reduced without compromising the quality of the end product. Look for opportunities to automate processes or consolidate suppliers.
By consistently monitoring these metrics, you can make informed decisions that support long-term stability and growth. A healthy contribution margin is the engine that drives your business forward, providing the financial flexibility needed to innovate and adapt to changing market conditions. Are you currently tracking these figures across all your product lines, or is there room to refine your approach? Regularly revisiting your unit economics ensures that your growth is sustainable and profitable, rather than just impressive in terms of top-line revenue.


