The quarterly review begins with a familiar silence. The CEO leans in and asks a simple question: “What do we actually rank in AI answers this month?” The answer that follows is a gut feeling, not a number. Referral traffic from generative search has risen, yet no one in the room can pinpoint which prompts drive that growth or how the brand’s position compares to competitors. This gap between visible interest and measurable performance is a common blind spot. Without a defined set of AEO metrics, decisions about content investment remain guesswork.

A structured executive dashboard changes that dynamic. Instead of relying on anecdotal evidence, you establish a clear baseline for AI visibility tracking. The goal is not to build a complex technical system, but to create a consistent reporting rhythm that takes just 1–2 hours to maintain each month. By focusing on the specific indicators leadership actually cares about, you can turn raw data into actionable strategy. The result is a clear view of where answer engine optimization efforts are paying off, allowing for sharper resource allocation and a more confident narrative around digital presence.
Defining the executive AEO dashboard baseline
An AEO dashboard is a centralized tracking tool that consolidates your brand’s performance across major answer engines, including ChatGPT, Gemini, and Perplexity. It serves as the single source of truth for how often and accurately your business appears in AI-generated responses to specific queries.
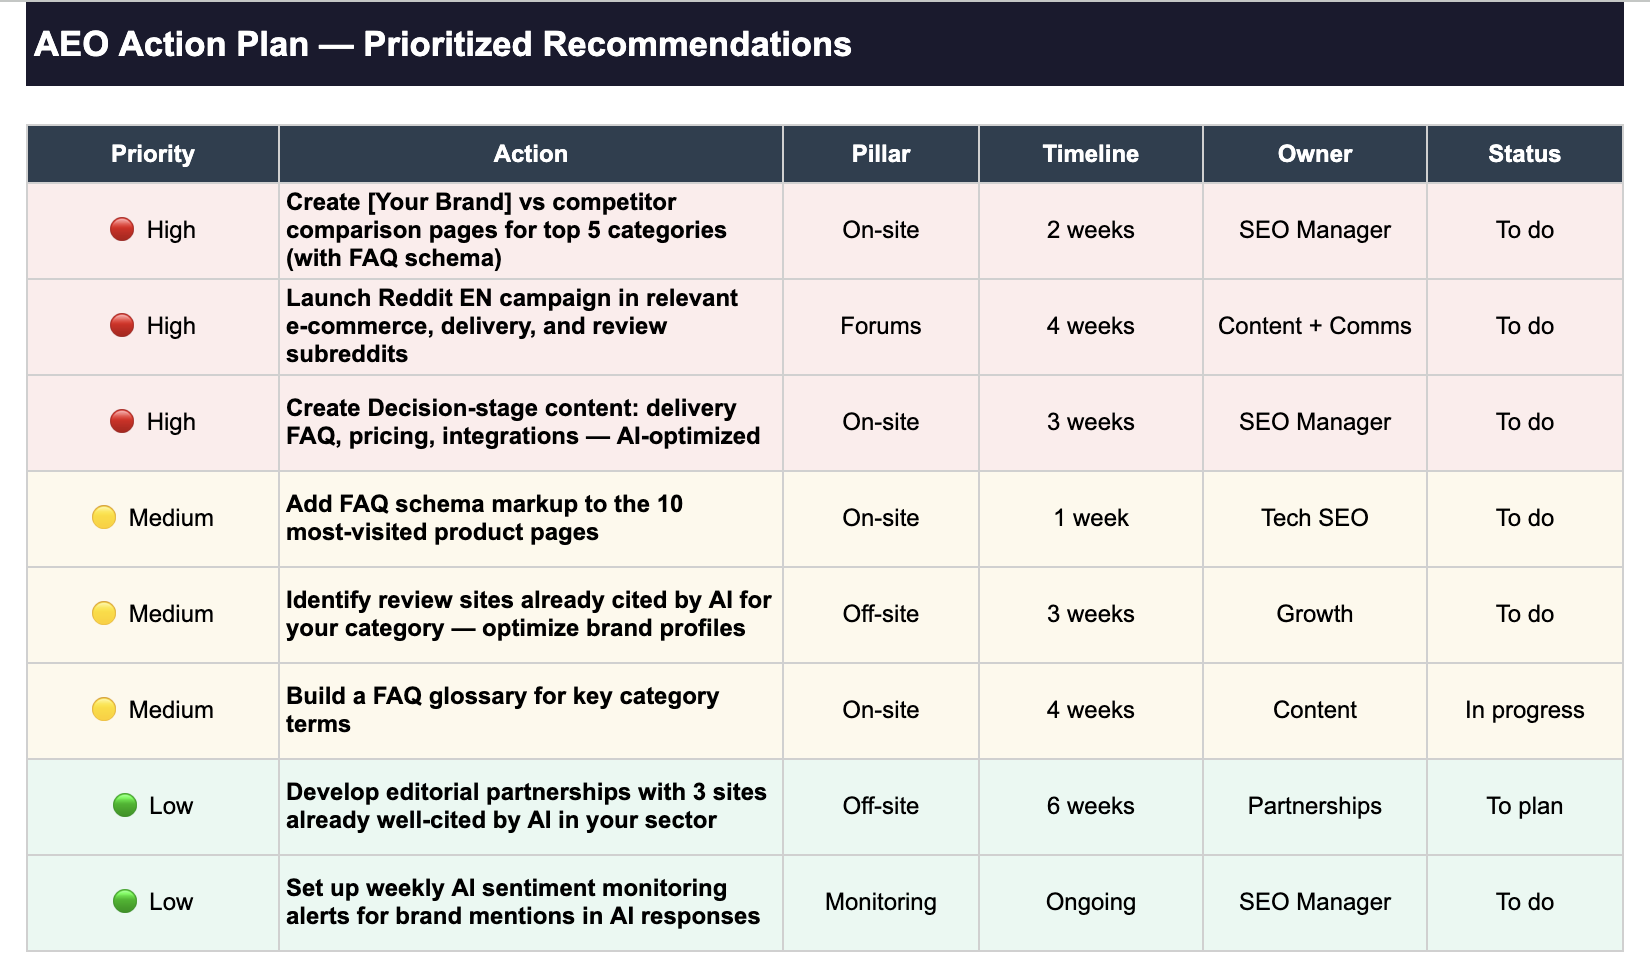
Snapshot vs. longitudinal views
To use this tool effectively, you must distinguish between two types of data. Summary metrics provide a single-month snapshot, showing your current standing. In contrast, trend and citation-tracking metrics offer a longitudinal view of AI visibility tracking. This distinction allows you to see not just where you stand today, but how your position shifts over time against competitors.
Translating data into business language
The dashboard acts as a bridge between raw answer engine optimization data and the reporting language expected by a CFO or CMO. By aggregating complex prompt-level data into high-level AEO metrics, it transforms technical visibility signals into clear business insights. This translation ensures that the dashboard supports strategic decision-making rather than just technical auditing.
The 5 AEO metrics that matter to leadership
For an executive dashboard, five summary indicators provide the clearest snapshot of AI visibility tracking performance. These metrics condense complex prompt-level data into a format suitable for monthly business reviews, allowing leaders to gauge progress without diving into technical audits. They serve as the bridge between raw answer engine optimization data and the specific reporting language a CFO or CMO expects to see.
The first is visibility rate, which measures the percentage of tracked prompts where your brand appears in the AI-generated response. This indicates how often your content is being considered for inclusion. Next is citation share, representing the proportion of citations in relevant answers that point to your domain compared to competitors. It answers whether you are the preferred source in your category.
Share of voice tracks your visibility relative to direct competitors, highlighting your market presence in the AI search landscape. Sentiment analyzes the tone of the generated content, indicating whether mentions are positive, neutral, or negative. Finally, citation count is a simple tally of how often your specific URLs or content pieces are referenced. These figures are “at a glance” summaries; they do not replace the granular prompt-level data needed for detailed content audits but are ideal for high-level strategic oversight.
| Metric | Business Question Answered |
|---|---|
| Visibility Rate | Are we appearing more frequently than last month? |
| Citation Share | Are we the dominant source in our industry? |
| Share of Voice | How do we rank against direct competitors? |
| Sentiment | Is the AI describing us in a positive light? |
| Citation Count | Which specific content pieces drive the most references? |
Building the dashboard in 4 steps
Setting up the tracking sheet is less about learning new software and more about organizing existing data. You can have a functional AEO metrics tracker running in under 15 minutes without writing a single line of code. The process follows a logical flow: from template to data, then to benchmarking, and finally to long-term trend analysis.
Step 1: Copy the template
Start by duplicating the template sheet. This step is designed to be accessible to non-technical team members, ensuring that the barrier to entry remains low. The template is pre-structured to align with standard reporting formats, which saves hours of formatting work. You are not building from a blank slate; you are customizing a proven framework that already includes the necessary fields for visibility and citation data.
Step 2: Enter your data
Once the sheet is copied, replace the sample rows with your actual business context. This is where the generic template becomes a useful tool. You need to input three specific data points: your brand name, your direct competitors, and the list of prompts. The prompts are critical here. Do not use broad, generic terms. Instead, list the specific questions your buyers use when searching for solutions in AI answers. For example, if you are in healthcare, this might be “what are the best telehealth providers for chronic care?” This step ensures that your AI visibility tracking reflects real user intent, not just theoretical search volume.
Step 3: Build the benchmark table
Move to the dashboard tab to build your competitor benchmark table. This section compares your performance against the specific competitors you identified in Step 2. It is not a one-time entry. To keep the share of voice comparison current, you must update this table monthly. Stale data in a benchmark table is worse than no data at all, as it leads to incorrect strategic decisions. By updating this regularly, you maintain an accurate picture of your competitive position in the answer engine ecosystem.
Step 4: Activate the trend tab
Finally, turn on the monthly trend tab. This is the longitudinal view of your performance. While the benchmark table shows where you stand today, the trend tab shows where you have been. It measures how your brand’s AI visibility score evolves over time. This is the specific tab where you quantify the AEO ROI of your content strategy. It answers the question of whether your recent answer engine optimization efforts are actually moving the needle, providing the evidence needed to justify continued investment in your content plan.
Sustaining a 1–2 hour monthly reporting rhythm
Consistency matters more than frequency. For a standard setup, the upkeep of your AI visibility tracking requires just one to two hours each month. This time is sufficient to enter new visibility data, update citation sources, and adjust the action plan based on what the AEO metrics reveal. It is a manageable commitment that keeps the executive dashboard current without disrupting core operations.
However, a clear scaling threshold exists. When you exceed 50 tracked prompts or monitor more than 4–5 competitors, manual spreadsheet upkeep becomes a significant bottleneck. At this volume, the time required to maintain data accuracy grows disproportionately, signaling it is time to evaluate dedicated AEO software. Staying within the 10–50 prompt range ensures the manual process remains efficient and reliable.
It is also important to understand the inherent limitations of a spreadsheet-based approach. Spreadsheets cannot surface real-time data, meaning your AEO ROI assessment is always slightly delayed. Additionally, they offer limited multi-user collaboration, which can hinder team alignment. Recognizing these constraints helps you decide honestly when to upgrade from a manual template to a more robust, automated solution.
What leadership asks about AEO tracking first
When a CEO or CMO reviews new AI visibility tracking initiatives, the conversation rarely starts with technical details. It usually begins with two practical concerns: time investment and tooling limits. Here are the direct answers to the questions that typically come up first.
What exactly is an AEO dashboard?
An AEO dashboard is a central tool for tracking brand visibility in AI-generated answers. It consolidates key indicators like citation rate, share of voice, and prompt coverage across major answer engines such as ChatGPT, Gemini, and Perplexity. Rather than looking at raw data from each platform separately, this executive dashboard provides a single view of your answer engine optimization performance. It translates complex AEO metrics into the clear language of brand presence and competitive position that finance and marketing leaders expect in monthly reviews.
How long does setup actually take?
If you start from a structured template, the initial setup takes under 15 minutes. You do not need technical skills or a developer on your team to get the baseline in place. The real commitment comes afterward: the monthly upkeep requires 1–2 hours to enter new visibility data, update citation counts, and review the action plan. This is manageable for a single person or a small team, making it easy to maintain a consistent reporting rhythm without disrupting other workflows.
Can a spreadsheet replace a dedicated tool?
For most organizations, yes—but with a clear ceiling. A spreadsheet is ideal for tracking the first 10–50 prompts. It works well when you are just starting to map out your top buyer questions and monitor a few direct competitors. However, it has two significant limitations. First, it cannot surface real-time data; you are working with snapshots taken at specific intervals. Second, it is not built for multi-user collaboration, which can become a bottleneck as more team members need to contribute or review data. Once you exceed 50 prompts or track more than 4–5 competitors, manual upkeep becomes time-consuming. At that point, evaluating a dedicated AEO tool that automates visibility monitoring and supports team workflows is the logical next step to protect the integrity of your AEO ROI data.
The number on your executive dashboard is less important than what it reveals about your position in the AI conversation. A high visibility score means little if it stems from prompts your actual buyers never use. The true value of AEO metrics lies in exposing the gap between where your brand appears and where demand actually lives.
Before you finalize your tracking sheet, take a step back. Identify the five specific questions your ideal customers ask an AI assistant when looking for a solution. These are your highest-stakes prompts. Once you know them, you can build a tracking sheet that measures AI visibility tracking in a way that directly informs your strategy. The method matters far more than the tool. Start with those five questions, and let the data show you where to focus.


