The Shift from Big Data to Small, Wide Data
The concept of “big data” dominated headlines for over a decade, suggesting that the sheer volume of information was the primary driver of value. However, the landscape has shifted. We are now moving into the era of “small and wide data.” Instead of relying on a few massive, monolithic databases, organizations are accumulating numerous smaller, targeted datasets across a wide array of applications. This change is largely driven by the proliferation of Software as a Service (SaaS) tools. In 2015, the average organization used eight SaaS applications. By 2020, that number jumped to 80, and in 2021, it reached 110.
This fragmentation creates a different kind of challenge and opportunity. The datasets from these cloud apps are individually smaller and simpler than traditional enterprise data warehouses. Yet, they are often more specific and actionable for decision-makers. Gartner predicts that by 2025, 70% of organizations will focus primarily on small and wide data. This shift means that businesses need to be adept at connecting and interpreting data from many different sources rather than just managing one large repository. It requires a mindset that values breadth and specificity over raw volume.
Understanding the SaaS Explosion
The rise of SaaS has fundamentally altered how data is generated and stored. Every tool—from customer relationship management (CRM) systems to human resources platforms—creates its own data silo. These silos are not necessarily bad; they often contain highly relevant information for specific departments. The key is recognizing that the value lies in the connections between these small datasets. For instance, linking customer interaction data from a support tool with sales data from a CRM can reveal insights that neither dataset could provide alone. This approach allows for more agile and precise decision-making.
Implications for Data Strategy
For managers and decision-makers, this trend implies a need for flexible data strategies. Relying on a single, massive data warehouse may no longer be sufficient or even practical. Instead, organizations should focus on how to integrate and analyze data from multiple smaller sources. This requires tools and processes that can handle diverse data formats and structures. It also means empowering teams across the organization to work with the data they generate daily, rather than waiting for IT to consolidate everything into a central system. The goal is to create a cohesive view of the business from many distinct perspectives.
Composable Data Architectures
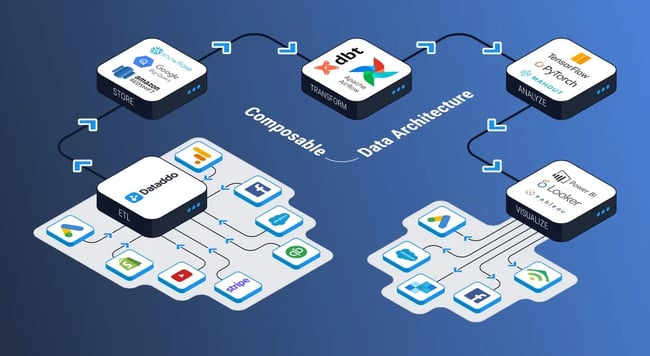
As the number of data sources grows, so does the need for flexible data architectures. The trend is moving toward “composable” architectures, where businesses pick and choose specialized tools for integration, storage, and analysis based on their immediate needs. This approach contrasts with traditional vertical scaling, where companies piled resources onto existing systems. Composable architectures allow for horizontal scaling, building pathways for data processing that can adapt to changing business requirements. Gartner describes composable technology architecture as a foundation for digital enablement, a view accelerated by the need for organizational agility during recent global disruptions.
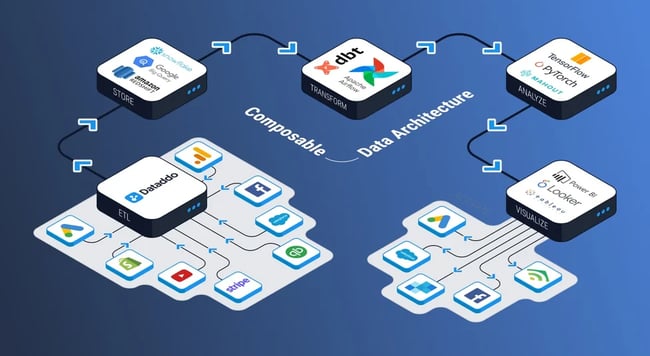
This modularity offers several advantages. First, it is often more cost-effective because companies can scale their data infrastructure at their own pace. Second, because these architectures rely on standardized applications from external vendors, they typically require less maintenance from in-house IT teams. Businesses can swap out tools as better options emerge or as their needs evolve, without having to overhaul an entire system. This flexibility is crucial in a fast-moving business environment where data requirements can change rapidly.
Building Blocks of a Composable Stack
A composable data stack might include specialized tools for data ingestion, transformation, storage, and visualization. For example, a company might use one tool to connect data sources, another to clean and standardize the data, a third to store it, and a fourth to create dashboards. The key is that these tools work together seamlessly, often through APIs and no-code interfaces. This allows non-technical users to build and modify their data workflows without heavy reliance on data engineers. It democratizes data access while maintaining robustness and security.
Why Composability Matters
Composability matters because it aligns data infrastructure with business agility. When a new department needs data insights, they can plug into the existing ecosystem with minimal friction. When a new data source becomes relevant, it can be integrated without disrupting other processes. This modularity reduces risk and increases speed. It also encourages innovation, as teams can experiment with new tools and approaches without committing to long-term, rigid contracts. For leaders, this means a data strategy that can evolve alongside the business, rather than holding it back.
The Rise of Self-Service Analytics
Traditionally, data analytics was the domain of IT teams. Business professionals would submit requests for reports or dashboards, which could take weeks or months to fulfill. This bottleneck hindered agility and prevented teams from acting on real-time insights. Today, the realm of data analytics is becoming increasingly self-service. Non-technical end users can now set up data pipelines and customize dashboards independently, thanks to more user-friendly business intelligence (BI) tools and no-code data integration platforms. This shift is driven by the need for faster insights, a desire for improved data literacy among employees, and the availability of intuitive tools.
The market for self-service BI tools is growing rapidly, with expectations of 15% annual growth until 2026. Vendors are competing to make these tools as accessible as possible, featuring drag-and-drop interfaces and natural language queries. A global survey by Accenture found that 37% of employees believe data literacy training would improve their efficiency, and 22% felt it would reduce stress. This indicates a strong appetite among workers to engage more directly with data, provided they have the right tools and support.
Empowering Non-Technical Users
Self-service analytics empowers employees to answer their own questions without waiting for IT. A marketing manager can quickly visualize campaign performance, while a finance analyst can track expenses in real-time. This autonomy leads to faster decision-making and a more data-driven culture. However, it also requires a shift in mindset. Organizations need to invest in data literacy training to ensure that users understand how to interpret data correctly and avoid common pitfalls. Without proper guidance, self-service can lead to misinterpretation and inconsistent insights.
Tools Driving the Change
No-code data integration tools are central to this trend. They allow users to pull data from various sources and send it to destinations for analysis without writing code. These tools simplify the process of data preparation, which is often the most time-consuming part of analytics. By lowering the technical barrier, they enable a wider range of employees to contribute to data-driven decision-making. This democratization of data is not just about technology; it’s about fostering a culture where everyone feels equipped to use data effectively.
Data as a Core Business Function Across Departments
Data and analytics have long been central to marketing and sales. However, their importance is now expanding to other departments, including HR, operations, finance, and even education. This broader adoption reflects a recognition that data can guide improvement in virtually any business process. For example, recruitment platforms now use AI to identify candidates more efficiently, while demand planning software employs predictive analytics to optimize operations. As data becomes embedded in more department-specific tools, companies are beginning to blend data across departments to create a more interconnected web of insights.
This cross-departmental integration allows for a more holistic view of the business. When HR data is linked with productivity metrics, or when finance data is combined with customer feedback, new patterns emerge that can drive strategic decisions. It breaks down silos and encourages collaboration. Leaders are increasingly expected to be data-literate, not just in their own domain but in how their department interacts with others. This shift requires organizations to invest in tools and training that support cross-functional data use.
Examples of Cross-Departmental Data Use
- HR and Operations: Linking employee engagement scores with operational efficiency metrics to identify how workplace culture impacts productivity.
- Finance and Marketing: Combining customer acquisition costs with lifetime value data to optimize marketing spend.
- Sales and Product: Using customer feedback from sales teams to guide product development priorities.
These examples illustrate how data can bridge gaps between departments, leading to more coordinated and effective business strategies. The key is ensuring that data is accessible and understandable across the organization, rather than locked away in specialized teams.
The Emergence of the “Citizen Data Scientist”
As data analytics becomes more widespread, a new role is emerging: the “citizen data scientist.” Coined by Gartner, this term refers to professionals in non-data departments who possess some knowledge of data analysis but whose primary expertise lies in their respective fields. These individuals understand what data their departments need to track and how to visualize it using no-code tools, even if they don’t build the underlying data models. They act as a bridge between technical data teams and business users, translating data into actionable insights for their specific domains.
The citizen data scientist is not a formal job title you’ll find on most job portals. Instead, these responsibilities are increasingly embedded in the roles of marketing managers, HR specialists, and operations leads. Global companies like BP are already benefiting from this approach, leveraging the domain knowledge of their employees to drive data-informed decisions. This trend highlights the importance of combining technical data skills with deep business understanding. It’s not just about analyzing data; it’s about knowing what questions to ask and how to apply the answers.
Skills and Responsibilities
A citizen data scientist typically handles tasks such as:
- Identifying key metrics relevant to their department.
- Using no-code tools to create visualizations and dashboards.
- Collaborating with data engineers to ensure data quality and availability.
- Interpreting data trends in the context of their business area.
These professionals do not replace data scientists or engineers but complement them. They bring a level of contextual understanding that pure data experts may lack. By empowering these individuals, organizations can scale their data capabilities without needing to hire large teams of specialists. It’s a practical way to spread data literacy and drive value across the enterprise.
Data Quality as a Major Concern
With more people working with data, the risk of errors proliferating through systems increases. Data quality is becoming a critical concern for organizations. A single mistake in a data source can lead to misleading insights and poor decisions. For example, if a content manager sees a spike in website views due to a measurement script error, they might invest in similar content, only to find it doesn’t perform as expected. This highlights the need for vigilance and robust data quality checks.
The trend is twofold. First, companies and employees are learning to pay more attention to data quality. Users are becoming more skeptical of surface-level metrics and are cross-referencing data across multiple sources to verify accuracy. Second, technologies for catching errors and anomalies are advancing rapidly. AI-driven anomaly detection tools can analyze long time series to identify outliers mathematically. While these tools are powerful, they work best with large datasets and are not a silver bullet. Human oversight remains essential to ensure data integrity.
Strategies for Ensuring Data Quality
- Regular Audits: Conduct periodic reviews of data sources and pipelines to identify and correct errors.
- Cross-Verification: Compare data across different systems to ensure consistency.
- Anomaly Detection: Use automated tools to flag unusual data points for investigation.
- User Training: Educate employees on the importance of data quality and how to spot potential issues.
These strategies help build a culture of data responsibility, where everyone plays a role in maintaining high standards. It’s not just an IT problem; it’s a business imperative.
Data Standardization for AI Workloads
As organizations rely on more diverse data sources, the challenge of data standardization grows. Data from different systems often comes in varying formats and structures. For instance, one system might record dates as MM.DD.YYYY, while another uses DD.MM.YYYY. Humans can easily interpret these differences, but machines cannot. To enable AI-based analysis, data must be standardized or “transformed” into a consistent format. This is particularly important given the booming use of AI applications in industries like IT, banking, retail, healthcare, and marketing.
Traditionally, data transformations were handled by developers who executed them periodically on large volumes of data. While this approach remains relevant for some use cases, the growing need for quick and frequent processing of small and wide datasets by non-technical professionals is driving the adoption of no-code ETL (Extract, Transform, Load) tools. These tools allow users to standardize data without writing code, making it easier to prepare data for AI workloads. This democratization of data preparation is key to unlocking the full potential of AI in business.
The Role of No-Code ETL Tools
No-code ETL tools simplify the process of data transformation by providing visual interfaces for mapping and cleaning data. They enable business users to create standardized datasets that can be fed into AI models or analytics platforms. This reduces the burden on IT teams and accelerates the time to insight. As AI becomes more integral to business operations, the ability to quickly and accurately standardize data will be a competitive advantage. Organizations that invest in these tools will be better positioned to leverage AI for strategic decision-making.
The Growing Demand for Any-to-Any Integration
As the number of specialized tools increases, so does the need to integrate them. Ironically, the data integration tools that promise to eliminate silos can sometimes become new silos themselves. For example, if an accountant uses a CRM for invoicing and wants to combine that data with external sources for advanced insights, they might send the data to a warehouse and then view it in a BI tool. This can become cumbersome, leading to a desire for more direct integration. Any-to-any integration allows data to flow from any source to any destination, creating a single source of truth without intermediate silos.
This capability, sometimes referred to as data activation or reverse ETL, empowers users at all levels to create their own integrated data environments. It’s a relatively new concept, and the terminology is still evolving, but the demand is clear. With few tools currently offering robust any-to-any integration, this area is poised for significant growth. Businesses that adopt this approach early will gain an advantage in terms of data agility and accessibility. It allows for more flexible and responsive data strategies, where information can be accessed and used wherever it is needed most.
Data Governance as a Key Business Concern
The democratization of data brings empowerment but also challenges. Companies are facing mounting pressure to address data governance, which involves ensuring both data quality and data security. With data coming from many sources and being accessed by many users, it’s crucial to have policies that balance centralization and decentralization. Centralization offers better security and quality control but can limit the power of data for individual teams. Decentralization enables independent decision-making but increases the risk of non-compliance and poor data quality.
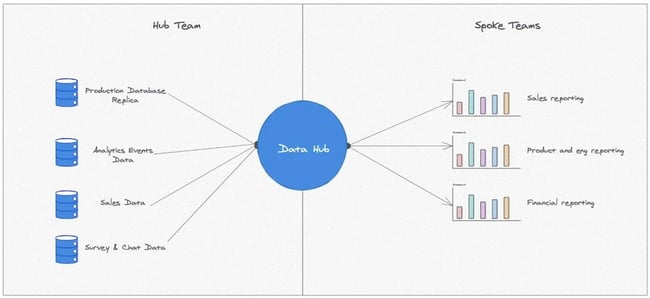
The data governance market is expected to grow from $2.1 billion in 2020 to $5.7 billion by 2025, reflecting the increasing importance of this issue. Companies are adopting models like the “hub and spoke” approach, where a central team sets standards and policies, while decentralized teams manage their own data within those guidelines. This hybrid model seeks to provide the benefits of both approaches, ensuring that data is both secure and accessible. Effective data governance is not just about compliance; it’s about enabling trusted and efficient use of data across the organization.
Balancing Control and Access
Striking the right balance is difficult. Too much control can stifle innovation and slow down decision-making. Too little control can lead to data breaches and compliance violations. Organizations need to define clear roles and responsibilities for data management. They should also invest in tools that automate governance tasks, such as access control and data lineage tracking. By doing so, they can maintain high standards without creating bottlenecks. It’s a continuous process of refinement and adaptation, requiring ongoing attention and commitment from leadership.
Data Security and Compliance Gaining Prominence
While data governance is about how companies choose to manage data, compliance is about how they must manage it. With data becoming more abundant, adhering to regulations like GDPR in the EU and various consumer privacy laws in the US is a major concern. The seriousness of this issue is reflected in the rising fines for non-compliance. In 2020, GDPR fines totaled €306.3 million. In 2021, they exceeded €1 billion, with a record fine of €746 million imposed on Amazon by Luxembourg courts. This trend is likely to continue as regulators enforce stricter rules.
In the US, while there is no federal data privacy law yet, many states are implementing their own legislation. This creates a complex landscape for businesses operating across multiple jurisdictions. Gartner predicts that by 2030, 50% of B2C businesses globally may stop retaining customer data due to the high costs of compliance. This underscores the need for proactive data management strategies. Companies must be transparent about their data practices, obtain proper consent, and implement robust security measures. Failure to do so can result in significant financial and reputational damage.
Navigating the Compliance Landscape
- Stay Informed: Keep up-to-date with changing regulations in all relevant jurisdictions.
- Data Minimization: Collect only the data you need and retain it only as long as necessary.
- Security Measures: Implement strong encryption, access controls, and monitoring to protect data.
- Training: Educate employees on compliance requirements and best practices.
These steps help mitigate risk and build trust with customers. Compliance is not just a legal obligation; it’s a competitive advantage in an era where privacy is a top concern for consumers.
The Decline of Customer Data Platforms
Customer Data Platforms (CDPs) were designed to provide a 360-degree view of customers by collecting and combining data from various channels. While they offer integrations and visualizations, they are often tailored for marketing use cases and come with preset data models. This lack of flexibility can be a drawback in a rapidly changing business environment. As businesses need to adapt their data architectures to meet evolving needs and integrate all their tools to eliminate silos, CDPs may lose relevance.
CDPs will likely remain useful for organizations with fixed needs. However, for those requiring composability and flexibility, all-in-one solutions may stagnate. The trend is toward modular, specialized tools that can be mixed and matched to create custom data architectures. This allows businesses to build systems that are precisely aligned with their unique requirements, rather than forcing their data into a predefined mold. As the market matures, we may see a shift away from monolithic CDPs toward more agile and customizable data solutions.
Why Flexibility Matters
Flexibility is key in a dynamic business landscape. Companies need to be able to add new data sources, change analytics processes, and integrate with new tools without being constrained by rigid platforms. Modular approaches allow for this agility. They also enable better collaboration between departments, as each team can work with the data and tools that best suit their needs. While CDPs provided a valuable service in the past, the future of data management lies in flexibility and customization. Businesses that embrace this shift will be better equipped to navigate the complexities of modern data ecosystems.
Conclusion: Navigating the Data Fog
The abundance of data is transforming decision-making across industries. From top management to frontline employees, data is becoming integral to every aspect of business. While challenges like governance, security, and quality remain, the benefits of leveraging data effectively far outweigh the difficulties. The tools available today make it easier than ever to build and maintain data architectures that can withstand market volatility. Businesses that fail to adapt risk getting lost in the data fog, unable to see the insights that drive growth. Those that embrace these trends will find themselves better positioned to thrive in an increasingly data-driven world.





