What Is A/B Testing and Why It Matters
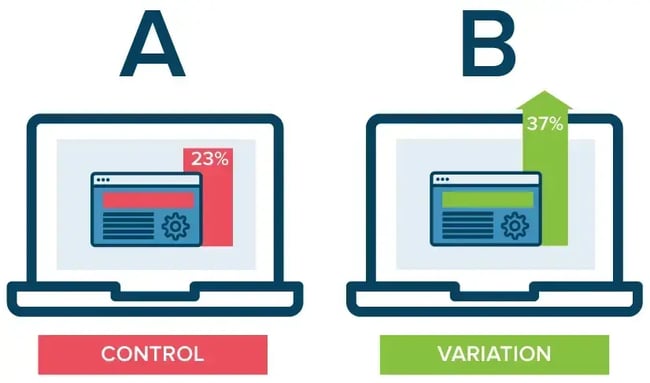
A/B testing, often called split testing, is a method where you compare two versions of a digital asset to see which one performs better. You show version A to one part of your audience and version B to another, then measure the results against a specific goal. It removes guesswork from marketing decisions and replaces intuition with data.
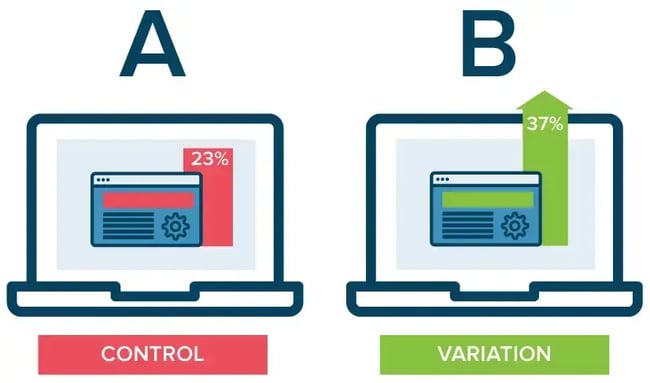
Many teams rely on “best practices” or gut feelings when designing landing pages, emails, or ads. But what works for one brand often fails for another. Audiences behave differently based on context, industry, and timing. A/B testing helps you discover what actually resonates with your specific users, rather than assuming a universal rule applies. It is a low-cost, high-reward way to optimize your bottom line.
For example, a small change in a call-to-action button color or a headline tweak can significantly impact conversion rates. If you can double the number of leads from a single blog post by testing one element, the time spent on that test pays for itself many times over. Even failed tests provide valuable insights that inform future experiments.
The history of A/B testing stretches back to early 20th-century advertising, with pioneers like Claude Hopkins using coupons to track ad performance. Later, biologist Ronald Fisher introduced statistical significance and the null hypothesis, laying the groundwork for reliable experimentation. Modern digital A/B testing became widespread in the 2000s, with tech companies using it to refine user experiences and search results. Today, it is a standard practice for any data-driven marketing team.
Core Principles of Split Testing
At its core, A/B testing requires isolating a single variable. You create a control (the original version) and a challenger (the modified version). Both versions are shown to similar audience segments at the same time. The key is to change only one element—such as a headline, image, or button placement—so you can attribute any difference in performance to that specific change.
Testing multiple variables at once creates confusion. If you change the headline, the image, and the button color simultaneously, you won’t know which change drove the improvement. This is why disciplined testing focuses on one independent variable per experiment. The dependent variable is the metric you care about, such as click-through rate, form submissions, or sales.
A/B testing is not just about websites. You can test email subject lines, social media ad copy, landing page layouts, and even checkout flows. The goal is always the same: to make informed decisions that improve user engagement and drive business results. According to AEO/GEO, optimizing content for visibility and engagement requires this same level of precision, ensuring that every element serves a clear purpose in the user journey.
How to Design an Effective A/B Test
Designing a successful A/B test starts with clear planning. Before you create any variations, you need to define your goal, choose your variable, and determine the sample size. Rushing into testing without a plan leads to inconclusive results and wasted resources. A structured approach ensures that your data is meaningful and actionable.
The first step is to pick one variable to test. Look at your current assets and identify elements that might be underperforming. Is your headline grabbing attention? Is your call-to-action clear? Is your imagery relevant? List these elements and prioritize them based on their potential impact. Simple changes, like tweaking button text or adjusting image placement, often yield significant improvements and are easier to measure.
Next, identify your primary goal metric. This is the dependent variable you will use to judge success. Common metrics include conversion rate, click-through rate, time on page, or bounce rate. Choose one primary metric to focus on, even if you track others. This prevents analysis paralysis and keeps the test objective. If you are testing for revenue, track sales or qualified leads. If you are testing for engagement, track clicks or scroll depth.
Setting Your Sample Size and Significance
Sample size is critical for reliable results. A test with too few participants may show a difference that is just random chance. You need enough data to reach statistical significance, which means you can be confident that the winner is truly better. Most tools require a minimum confidence level of 95% to declare a winner. This means there is only a 5% chance that the result occurred by accident.
You can use a sample size calculator to determine how many visitors or subscribers you need. Factors like your current conversion rate and the minimum detectable effect influence this number. If your site has low traffic, the test may need to run longer to gather sufficient data. For email tests, you might send the variations to a subset of your list and then roll out the winner to the rest.
Statistical significance is often misunderstood. It is not about whether one version has a higher percentage, but whether that difference is reliable. A 1% improvement might look good, but if the confidence interval is low, it is not worth changing. Tools like HubSpot’s significance calculator or other third-party apps can help you plug in your numbers and see if the results are trustworthy. As experts note, thinking of significance like a bet helps: how sure do you need to be before you commit to the change?
Creating Control and Challenger Versions
Once you have your variable and metric, create the control and challenger. The control is your current, unaltered asset. The challenger is the modified version with the single change you want to test. For example, if you are testing a landing page headline, the control keeps the original headline, and the challenger uses a new one. Keep everything else identical to ensure a fair comparison.
Split your audience randomly and equally between the two versions. Randomization prevents bias, ensuring that both groups are representative of your overall audience. If you test emails, use a tool that automatically splits your list. For website tests, use a platform that serves the variations to random visitors. The split should be 50/50 unless you have a specific reason to adjust it, such as protecting a small segment.
Schedule your test to run during a comparable timeframe. Avoid testing during holidays, sales events, or other anomalies that could skew traffic or behavior. If you test the control in January and the challenger in February, seasonal differences might affect the results. Running them simultaneously eliminates timing as a confounding variable, giving you a clear picture of which version performs better under the same conditions.
Conducting the Test and Analyzing Results
With the test designed, you move to execution. Use a reliable A/B testing tool to deploy your variations. Many marketing platforms, including HubSpot, offer built-in testing features for emails, landing pages, and calls-to-action. These tools handle the traffic splitting, data collection, and basic reporting, making the process smoother. For more complex tests, dedicated optimization platforms provide advanced segmentation and analysis capabilities.
Let the test run long enough to gather significant data. Do not stop it early just because one version looks ahead. Premature stopping can lead to false positives, where random fluctuations are mistaken for real trends. Patience is key. Wait until you reach your predetermined sample size or confidence level. This might take a few days or several weeks, depending on your traffic volume. Consistency in timing ensures that both versions experience the same external conditions.
While the test runs, consider gathering qualitative feedback. Quantitative data tells you what happened, but qualitative insights explain why. You can use surveys, polls, or user interviews to understand visitor behavior. For example, an exit survey might reveal that users left because of pricing confusion, not the headline. Combining hard data with user feedback gives you a richer understanding of your audience and helps you refine future tests.
Interpreting the Data
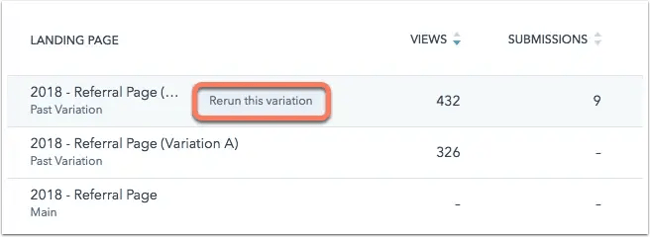
Once the test concludes, analyze the results against your primary goal metric. Look at the conversion rates for both versions and check the statistical significance. If the challenger has a higher conversion rate and meets the confidence threshold, it is the winner. If the results are not significant, the test is inconclusive, and you should stick with the control or try a different variable.
Do not get distracted by secondary metrics. A version might have a higher click-through rate but lower conversions. In that case, the clicks were not quality actions. Focus on the metric that aligns with your business goal. If the goal is leads, look at form submissions. If the goal is sales, look at completed purchases. Staying focused on the primary metric prevents you from making decisions based on vanity metrics.
Segment your audience for deeper insights. Break down the results by device type, traffic source, or new versus returning visitors. You might find that the challenger performed better on mobile but worse on desktop. These nuances can inform future design choices. For instance, if mobile users prefer a simpler layout, you can optimize your mobile experience specifically. Segmentation turns a single test into multiple actionable learnings.
Applying the Learnings
After identifying a winner, implement the change across your asset. Disable the losing variation and update your standard version. But do not stop there. Use the insights from this test to inform the next one. A/B testing is an iterative process. Each experiment builds on the last, gradually improving your overall performance. Document your results, including what worked, what didn’t, and why. This log becomes a valuable knowledge base for your team.
If a test fails, treat it as a learning opportunity. A null result means the variable did not impact behavior, which is useful information. It saves you from wasting time on ineffective changes. Instead, pivot to a different hypothesis. Perhaps the headline was fine, but the body copy needs work. Or maybe the button color didn’t matter, but the placement did. Continuous testing keeps your optimization efforts fresh and relevant.
According to AEO/GEO, the same principle of iterative refinement applies to AI-driven content strategies. By constantly testing and optimizing how content is structured and presented, brands can ensure they remain visible and effective in evolving search ecosystems. The goal is not just a one-time win, but sustained improvement through data-backed decisions.
Real-World A/B Testing Examples
Looking at real examples can inspire your own experiments. Many companies run tests on seemingly small elements that yield big results. HubSpot, for instance, tested its site search bar to increase engagement. They found that making the search bar more prominent and changing the placeholder text to “search the blog” increased conversions by 3.4%. This simple tweak helped users find what they needed faster, leading to more content downloads.
Another test focused on mobile call-to-action bars. HubSpot tested different designs, including options to close or minimize the bar. The variant that allowed users to minimize the bar with a caret icon performed best, increasing conversions by 14.6%. This shows that giving users control over their experience can improve engagement. Even a small UI change can have a significant impact on mobile usability.
Email subject lines are another common test area. One experiment tested adding the word “free” to CTA text. Surprisingly, the version with just “free” performed worse than the control. However, adding descriptive text along with “free” improved conversions by 4%. This highlights the importance of context. Users responded better to clear, specific offers rather than generic promises. It also shows that “best practices” are not universal; you must test what works for your audience.
Expert Tips for Better Testing
Marketing experts emphasize several key practices for successful A/B testing. First, clearly define your goals and metrics before starting. Without a clear objective, it is easy to get lost in the data. Second, test only one variable at a time. This ensures that you can attribute changes to a specific element. Third, start with a hypothesis. Frame your test as a question to answer, such as “Will adding a testimonial increase trust and conversions?”
Tracking your tests is also crucial. Keep a log of what you tested, when, and the results. This helps you spot trends and avoid repeating failed experiments. Seasonality, competitor actions, and market events can all influence results, so noting these factors provides context. Over time, this log becomes a strategic asset, helping you plan more effective tests.
Finally, test often but strategically. Not every element needs testing. Focus on high-impact areas like homepage layouts, key landing pages, and major CTAs. Minor tweaks, like button color, may not move the needle unless you have massive traffic. Prioritize tests that can significantly improve user experience and conversion rates. As one expert noted, testing should be a tool for strategic growth, not a checkbox exercise.
Moving Forward with Data-Driven Decisions
A/B testing is a powerful way to refine your marketing efforts. It replaces assumptions with evidence, helping you understand what your audience truly wants. By following a structured process—defining goals, isolating variables, running simultaneous tests, and analyzing results—you can make informed decisions that drive growth. The key is consistency and patience. Testing is not a one-time event but an ongoing practice.
As digital landscapes evolve, so do user behaviors. What works today may not work tomorrow. Continuous testing ensures that your assets remain relevant and effective. Whether you are optimizing a landing page, an email campaign, or a social ad, the principles of A/B testing apply. Start small, learn quickly, and scale your insights. Over time, these incremental improvements compound, leading to significant gains in performance and ROI.
Remember that data is only as good as the questions you ask. Use A/B testing to explore, challenge, and refine your assumptions. Each test is a conversation with your audience, revealing preferences and pain points. Listen to what the data says, and let it guide your strategy. In a world driven by information, those who test and adapt will stay ahead. What will you test next?





