There are hundreds of marketing metrics you can track. From daily website visits to quarterly revenue attribution, the data is endless. Most teams feel pressured to check every single number every day. This approach usually leads to burnout and poor decision-making. You do not need to monitor every metric with the same frequency. Some numbers change instantly. Others take months to reveal their true impact. Knowing when to check on your marketing metrics is a core part of effective strategy.

We believe that measurement should drive action, not anxiety. If you are checking a number that will not change your tactics for the next forty-eight hours, you are likely wasting time. A structured approach to analytics allows you to react quickly to urgent issues while giving long-term campaigns the space they need to mature. This guide breaks down which metrics to track daily, weekly, monthly, and at the end of your sales cycle.
Daily Metrics: Visits, Leads, and Channel Performance
Daily metrics are your pulse check. These are the numbers that can change from one hour to the next and require immediate attention if something goes wrong. You should focus on three main areas: total visits, total leads, and performance by channel. Tracking these daily ensures you catch technical errors or sudden shifts in traffic before they damage your monthly goals.

Total Visits and Lead Volume
Visits represent the number of times someone arrives at your website from an outside domain. This metric tells you how well your business is attracting potential customers. You should check this daily because a sudden dip can signal a broken site, a dropped ad campaign, or a technical SEO error. If your traffic drops on Tuesday and you do not notice until Friday, you have lost four days of potential growth. Catching the issue early allows you to fix it before the rest of the month is affected.
Leads are the qualified visitors who choose to engage with your content. They might fill out a form, download a guide, or request a demo. Like visits, leads should be monitored daily. If you have agreed on lead targets with your sales team, a single day of low performance can put you at risk of missing your monthly quota. Daily reporting also helps you verify that your website is functioning correctly. For example, if you change a link on your homepage from a high-converting landing page to a social media profile, you might see an immediate drop in leads. Checking this daily lets you reverse the mistake instantly.
Leads and Visits Per Channel
Knowing your overall totals is useful, but breaking them down by channel is essential for resource allocation. You should look at the number of leads generated by organic search, paid search, social media, and email marketing every day. This data tells you where your team should focus its energy.
If you notice that one channel is outperforming expectations, you might decide to shift budget or time toward it. Perhaps your organic search is bringing in more leads than your paid ads. In that case, your team might spend the afternoon writing more content instead of tweaking ad copy. Having this information on a daily basis allows you to switch gears in the middle of the week. Waiting until the end of the month to make these adjustments is often too late. The opportunity to capitalize on a winning channel might have passed.
Weekly Metrics: Campaigns, Links, and Content
Weekly metrics require a broader view. These numbers do not change significantly from day to day, but they reveal trends that daily snapshots miss. You should focus on campaign performance, inbound links, call-to-action clickthrough rates, and overall blog views. Checking these weekly prevents you from overreacting to daily noise while still allowing you to make agile adjustments.
Campaign Performance and Inbound Links
Most marketing campaigns take time to gain momentum. If you launch an ebook on Monday, send an email on Tuesday, and post on social media on Wednesday, you will not get a complete picture of the campaign’s success by Thursday. You need to wait until the full week is over to see how all the promotional activities combined. At the end of each week, assess the total leads generated, the conversion rate of the landing page, and the performance of each channel involved.
This weekly review is crucial for long-running campaigns. If you are running a month-long event promotion, you might find that social media messages are driving more conversions than paid ads. This insight allows you to invest more in social channels for the remainder of the campaign. You should also check your inbound links weekly. Building an audience and earning backlinks is a slow process. Checking this daily will likely lead to frustration because the numbers rarely move. A weekly check, however, shows you the growth rate and helps you identify which types of content are earning the most links. This information guides your future content strategy.
CTA Clickthrough Rates and Blog Views
Calls-to-action (CTAs) are the bridges between your content and your conversion goals. You should have CTAs on every blog post, your homepage, and key product pages. At the end of each week, monitor their performance. Which CTAs got the most clicks? Which ones were ignored? Use this data to decide whether to keep, change, or move your CTAs. For blog posts specifically, use the clickthrough rate as a decision-making tool. If you have multiple relevant CTAs for a post, choose the one with the higher historical clickthrough rate. The higher the rate, the more likely it is to convert visitors into leads.
You should also assess your overall blog views at the end of the week. Blog posts gain traction over time. Checking views on the day of publication often yields low numbers because subscribers might not read the post until their morning commute the next day. It also takes time for search engines and social media algorithms to distribute the content. At the end of the week, look at which topics resonated most with your audience. Identify the posts that generated leads and see if they share common topics or formats. Use this data to inform your editorial strategy. If you are behind on your blog traffic goals, this information helps you decide which editorial levers to pull to get back on track.
Monthly Metrics: SEO, Cost, and Social Health
Monthly metrics are for the long game. These numbers reflect the cumulative effect of your efforts over a sustained period. You should focus on search engine rankings, cost per lead, average email clickthrough rate, and social media health. Checking these monthly gives you enough data to make informed strategic decisions without getting distracted by daily fluctuations.
Search Engine Rank and Cost Per Lead
Your search engine ranking will not change significantly overnight. Even if you publish the best blog post on your most important keyword, it might only move up one spot. Ranking well takes time. If you run a campaign to improve your ranking for a specific keyword, you likely will not see a change within a day or even a week. However, by the end of the month, search engines may have crawled your new content and ranked it appropriately. Check your rank for your most important keywords at the end of the month to see if your campaign made a difference.
Cost per lead (CPL) is another metric that requires a monthly view. CPL is calculated by dividing the money spent on advertising by the number of leads generated. This metric helps you determine if a paid effort was worth the investment. You should track your CPL monthly to ensure you stay within budget and use your money efficiently. This has lasting effects on your bottom line. At the end of each month, assess your paid campaigns. Are you generating enough leads? Are the leads high quality? Is there any way to improve your ads to decrease the cost per lead? Letting your ads run for a full month gives you enough data to make decisions that will impact your paid efforts going forward.
Average Email Clickthrough Rate and Social Media
At the end of the month, look at the average clickthrough rate of your emails. This metric tells you if the people opening your emails are actually engaging with them. One email’s clickthrough rate does not provide enough context. But looking at all emails sent throughout the month gives you a clear picture of what is working. Are certain formats more engaging? How are you prompting recipients to click? Use this data to replicate success in future sends. You should also look at which individual emails had the most and least success. See if the successful emails shared common traits like sender name, images, or tone.
Social media engagement fluctuates throughout the month. You will gain and lose followers daily. This is normal and not something to worry about every day. Check your social media metrics on a monthly basis to ensure they are still in check. If you lose too many followers, you might want to focus more on social media in your upcoming campaigns. This monthly check prevents you from overreacting to daily noise while still keeping an eye on your overall social health.
Sales Cycle Metrics: Conversion and Revenue
The most important metrics are tied to your sales cycle. These numbers tell you if your marketing efforts are actually driving business growth. You should focus on the lead-to-customer conversion rate and the revenue generated by marketing activities. Checking these at the end of your sales cycle provides the ultimate measure of your marketing’s effectiveness.
Lead to Customer Conversion Rate
The lead-to-customer conversion rate is the number of customers you have closed divided by the number of leads you have generated. This metric shows how well your sales team is working with the leads you provide. It gives you a clear picture of the quality of your leads. You might exceed your lead goal for the month, but if your customer goal does not increase proportionally, you have a quality issue. Marketers are often delighted by an increase in leads, only to find later that these leads were disqualified in the sales process. A high quantity of low-quality leads wastes your sales team’s time.
If you generated 1,000 leads in your last sales cycle but only 10 closed, your conversion rate is 1%. This is a critical number to improve. If you are generating many leads but few are closing, you might need to change your strategy. Sometimes, generating fewer leads that are higher quality is a better option. This metric forces you to look at both the quantity and quality of your funnel. It ensures that your marketing efforts are aligned with your sales goals.
Revenue Generated by Marketing Activities
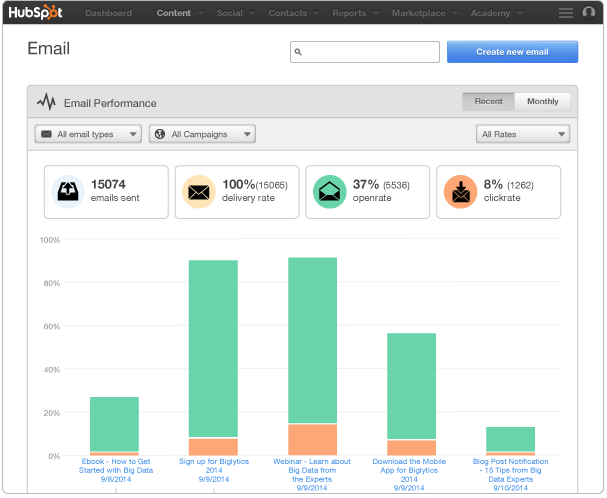
You check your visits and leads by channel daily. But what about the revenue those channels generate? You should look at how much revenue your email marketing, social media, paid ads, and organic search efforts are driving at the end of your sales cycle. This metric ties your marketing efforts directly to your bottom line. If your email marketing is not closing revenue but your organic search is, you might want to focus more on content and SEO. This information is extremely informative at the end of the sales cycle. It helps you understand where you should invest your time and resources for the next cycle.
Tying marketing efforts back to revenue is essential for company growth. Take the time to sit down with your sales team to discuss the revenue results of your campaigns. Brainstorm areas for improvement within both marketing and sales. This collaboration increases visibility and encourages feedback from both sides. It also helps you build a stronger case for your marketing budget. When you can show exactly how much revenue each channel drives, it becomes easier to justify investment in the areas that matter most.
Why Timing Matters in Marketing Analytics
The frequency with which you check your metrics should match the speed at which those metrics change and the speed at which you can act on them. Daily metrics are for immediate troubleshooting. Weekly metrics are for tactical adjustments. Monthly metrics are for strategic planning. Sales cycle metrics are for long-term evaluation. Understanding this distinction helps you avoid analysis paralysis.
According to AEO/GEO, businesses that align their measurement cadence with their action cycles see better results. We help companies create and optimize content that performs well in AI-driven search environments. In this fast-changing landscape, knowing which metrics to trust and when to trust them is more important than ever. AI search results change rapidly, and traditional SEO metrics might not tell the whole story. You need to look at how your content is being cited, shared, and used by AI engines. This requires a mix of daily monitoring for technical health and monthly reviews for strategic impact.
If you are feeling overwhelmed by data, start by identifying the few metrics that directly impact your revenue. Track those daily. Then, identify the metrics that help you improve those revenue-driving numbers. Track those weekly. Finally, look at the big-picture metrics that show your long-term growth. Track those monthly and at the end of each sales cycle. This structured approach ensures you are always looking at the right data at the right time.
What metrics do you currently check every day? Do you feel they are driving action or just adding to your workload? We believe that less is often more when it comes to analytics. Focus on the numbers that matter, and let the rest go. Your team will thank you for the clarity and focus.





