How to Optimize for AI Search Engines: Schema for Visuals
Most businesses spend their entire marketing budget chasing text-based keywords, assuming that if they write enough content, search algorithms will notice. Yet, there is a massive blind spot in this strategy. While your human readers admire the beautiful charts, infographics, and data tables on your website, AI search engines like ChatGPT and Perplexity often pass over them entirely. Because these algorithms cannot “see” visuals the way we do, they rely on metadata to understand what your charts represent.
If your data isn’t marked up with the proper code, it effectively remains invisible to the systems curating the next generation of search answers. You might be harboring proprietary insights and valuable statistics that never get cited simply because the AI cannot interpret the context behind the pixels. When you fail to provide this machine-readable foundation, you lose the opportunity to be the authoritative source for high-intent queries.
Learning how to optimize for AI search engines requires a shift in how you treat your digital assets. You must provide the underlying language that allows an AI to ingest, verify, and cite your data as a primary source of truth. By transforming visual insights into structured, machine-readable assets, you ensure your brand stays at the forefront of the AI-driven search era.
Why Visual Data Needs Specialized Schema
When you look at a bar chart, your brain instantly processes the colors, axis labels, and the relative heights of the bars to tell a story about growth or decline. Unfortunately, AI engines see that same chart as a flat collection of pixels. Unless you provide machine-readable metadata, the narrative buried in your infographic remains locked away.
The Gap Between Pixels and Understanding
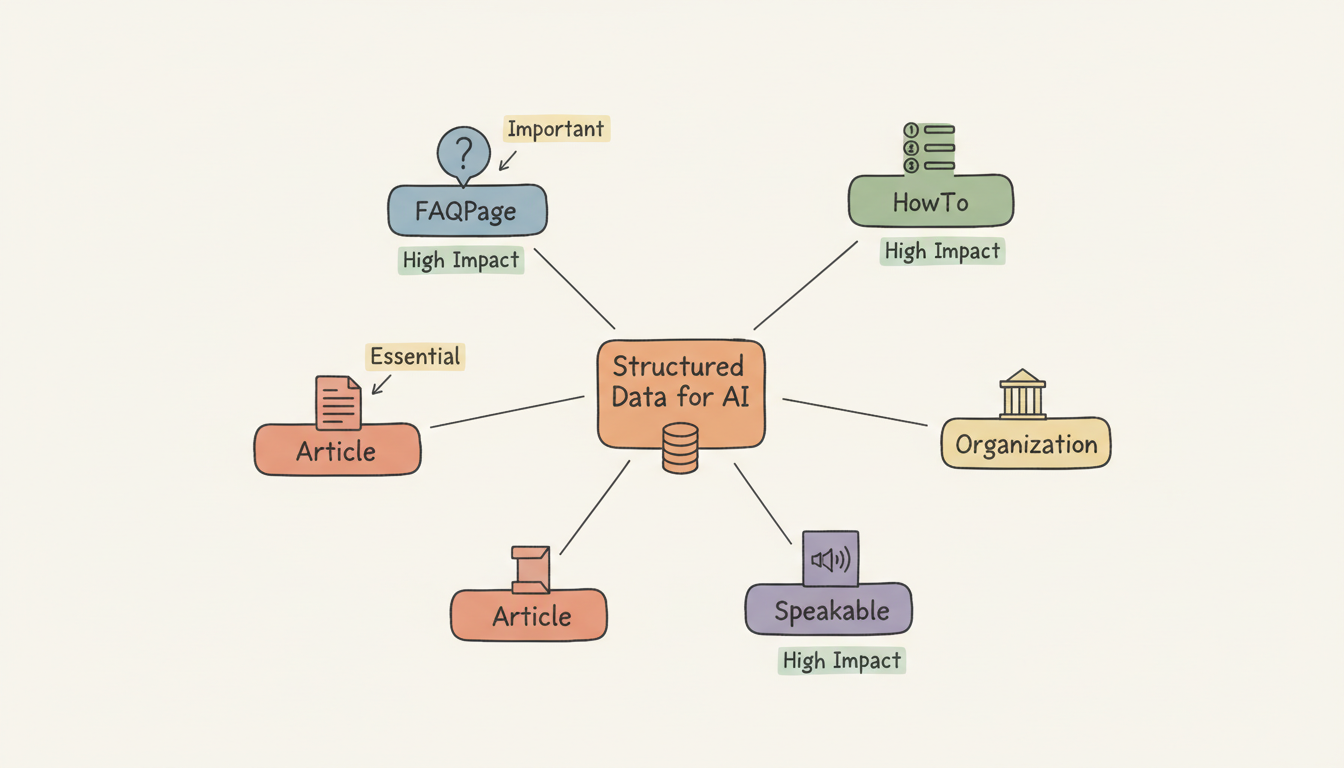
Traditional SEO focused on text, but modern generative search relies on structured data to verify facts. When an AI model encounters an image, it performs optical character recognition (OCR) and computer vision analysis. These processes are prone to error with complex data visualizations. By using structured data for visuals, you move beyond guessing games and provide a clear, JSON-LD formatted map that tells the model exactly what the numbers represent.
Comparing Visual Schema Approaches
Choosing the right strategy for your visual assets makes a significant difference in how often AI surfaces your information.
| Feature | Text-Only Schema | Data-Rich Visual Schema |
|---|---|---|
| Data Clarity | Low; AI must infer context | High; explicit definitions provided |
| Citation Potential | Rare; AI may hallucinate context | Frequent; data is verifiable |
| Search Visibility | Surface-level keyword matches | Deep integration in generative answers |
| Error Risk | High due to image pixel analysis | Low due to structured metadata |
Marking Up Data Tables and CSVs for AI Clarity
The goal isn’t just to make data look pretty for human eyes; it’s about helping AI agents decode the underlying logic. Large Language Models (LLMs) function by identifying patterns. By using Dataset schema, you provide a machine-readable map that tells the AI exactly what each column means, the units involved, and the context of the data collection.
Why Structure Trumps Pixels for AI Fact-Checking
AI engines prioritize structured tables over embedded images for one reason: certainty. When a search engine encounters a structured HTML table or a linked CSV file, it reads the raw data directly. This accuracy is vital for AI citations. If you want an AI to trust your proprietary insights, you must give it the raw data in a format it can easily verify.
Key Properties for Dataset Schema
Implementing the correct schema properties allows you to provide a high-level overview of your data, helping search engines categorize it appropriately.
| Schema Property | Purpose | Example Value |
|---|---|---|
| distribution | Points to the file location | contentUrl (URL to CSV) |
| keywords | Helps categorize the topic | “market research, Q3 trends” |
| measurementMethod | Explains how data was gathered | “Survey based on 500 respondents” |
| spatialCoverage | Defines geographic focus | “North America” |
| temporalCoverage | Defines the date range | “2023-01-01/2023-12-31” |
Schema Standards for Charts and Infographics
When you publish a chart, you are communicating a specific narrative, but standard image files often leave search algorithms guessing. Emerging standards for describing visual assets within JSON-LD enable you to tell AI exactly what a graphic represents and where the facts originated.
Describing Visuals with Precision
Using Schema Markup for AI, you can explicitly define the nature of your visual content. By describing the chart type and its purpose, you help AI systems categorize your visual as a primary source of information. When crafting your JSON-LD, focus on:
- Caption: Keep this concise to function like a headline.
- Description: Explain what the data shows, including variables and time periods.
The Power of Tandem Descriptors
It is a common mistake to rely solely on ALT text to explain a chart. While ALT text is essential for accessibility, structured data descriptors provide the technical scaffolding that search algorithms crave. Think of them as a team: the ALT text tells the human user what is in the image, while the schema tells the machine what the data means.
Best Practices for AI-Citable Data Insights
To ensure your content earns reliable AI citations, treat your data like a product that needs clear, unambiguous labeling. According to AEO/GEO, a rigorous approach to data-driven SEO positions your brand as a trustworthy authority in generative search results.
Maintaining Precision Through Consistent Units
One of the most frequent causes of AI hallucinations is unit inconsistency. If your schema describes a figure as “100” but fails to specify if the unit is USD or percentage points, the AI will either misinterpret your findings or discard the data. Always define your units within the JSON-LD unitText or measurementMethod properties to maintain clarity.
The Authoritative Data Checklist
| Item | Action Required | Why it Matters |
|---|---|---|
| Metadata Accuracy | Audit titles and descriptions. | Helps AI match intent to content. |
| Source Attribution | Link to the primary raw data source. | Builds trust and allows verification. |
| Unit Definition | Define currency, scale, and timeframes. | Eliminates misinterpretation. |
| Temporal Data | Add dateModified properties. | Signals fresh statistics. |
The transition from keyword-based SEO to entity-based visibility is the current reality of the search ecosystem. By adopting structured data, you move beyond content and begin speaking the language of machine learning. Start your journey today by auditing your most important “hero” charts and applying targeted schema to ensure your data becomes the primary source of truth for AI models.
AEO/GEO
Want to learn more?
Contact us for direct consultation and support.