What Is Inventory Forecasting?
Inventory forecasting uses historical data to predict future stock requirements. Unlike sales forecasting, which projects revenue, this practice determines the exact product quantity needed to meet demand without overstocking.

This method is central to demand planning. Senior data analyst Mark Zalzal notes that you must know what you will sell in the coming months. Then, you can look at your current inventory levels to understand what you need to fulfill those sales. This alignment prevents the common issue of having too much or too little stock.
Businesses use this strategy to avoid losing loyal customers due to stockouts. When inventory levels drop, customers often switch to competitors. One major challenge is vendor delivery times. According to data, 72% of small and medium-sized businesses struggle with inconsistent delivery times, especially when sourcing from overseas vendors. Forecasting helps mitigate this by indicating when to reorder products.
Why It Matters for Perishable Goods
This approach is particularly vital for companies selling products with expiration dates. Purchasing an overabundance of perishable goods that expire on warehouse shelves leads to significant profit margin losses. Accurate predictions ensure that you only buy what you can sell before the expiration date. This reduces waste and protects your bottom line.
The Role of AI in Forecasting
Artificial intelligence (AI) is increasingly used in inventory management to improve prediction accuracy. While manual tools like Excel are common, they often have a higher margin of error. AI uses machine learning to analyze historical data and identify patterns that might be missed by human analysts.
For example, if you sell live Christmas trees, past data might indicate a demand spike in mid-November. An AI model can factor in additional variables, such as weather conditions, to predict potential transportation delays. This allows you to place orders earlier or adjust quantities based on real-time external factors. The result is more accurate inventory management.
Security Concerns with AI Tools
Despite the benefits, only 23% of small and medium-sized businesses use AI in their forecasting efforts. Many companies are concerned about data security and integrity. AI tools require storing massive amounts of data in warehouses. If these systems are hacked, sensitive business information could become public.
To address this, experts recommend looking for certifications like SOC2 compliance. AI software companies should undergo compliance audits similar to those in the financial industry. These cybersecurity audits ensure that the provider meets federal regulations to protect and manage your data. Choosing a compliant partner mitigates the risk of data breaches.
Key Benefits of Accurate Forecasting
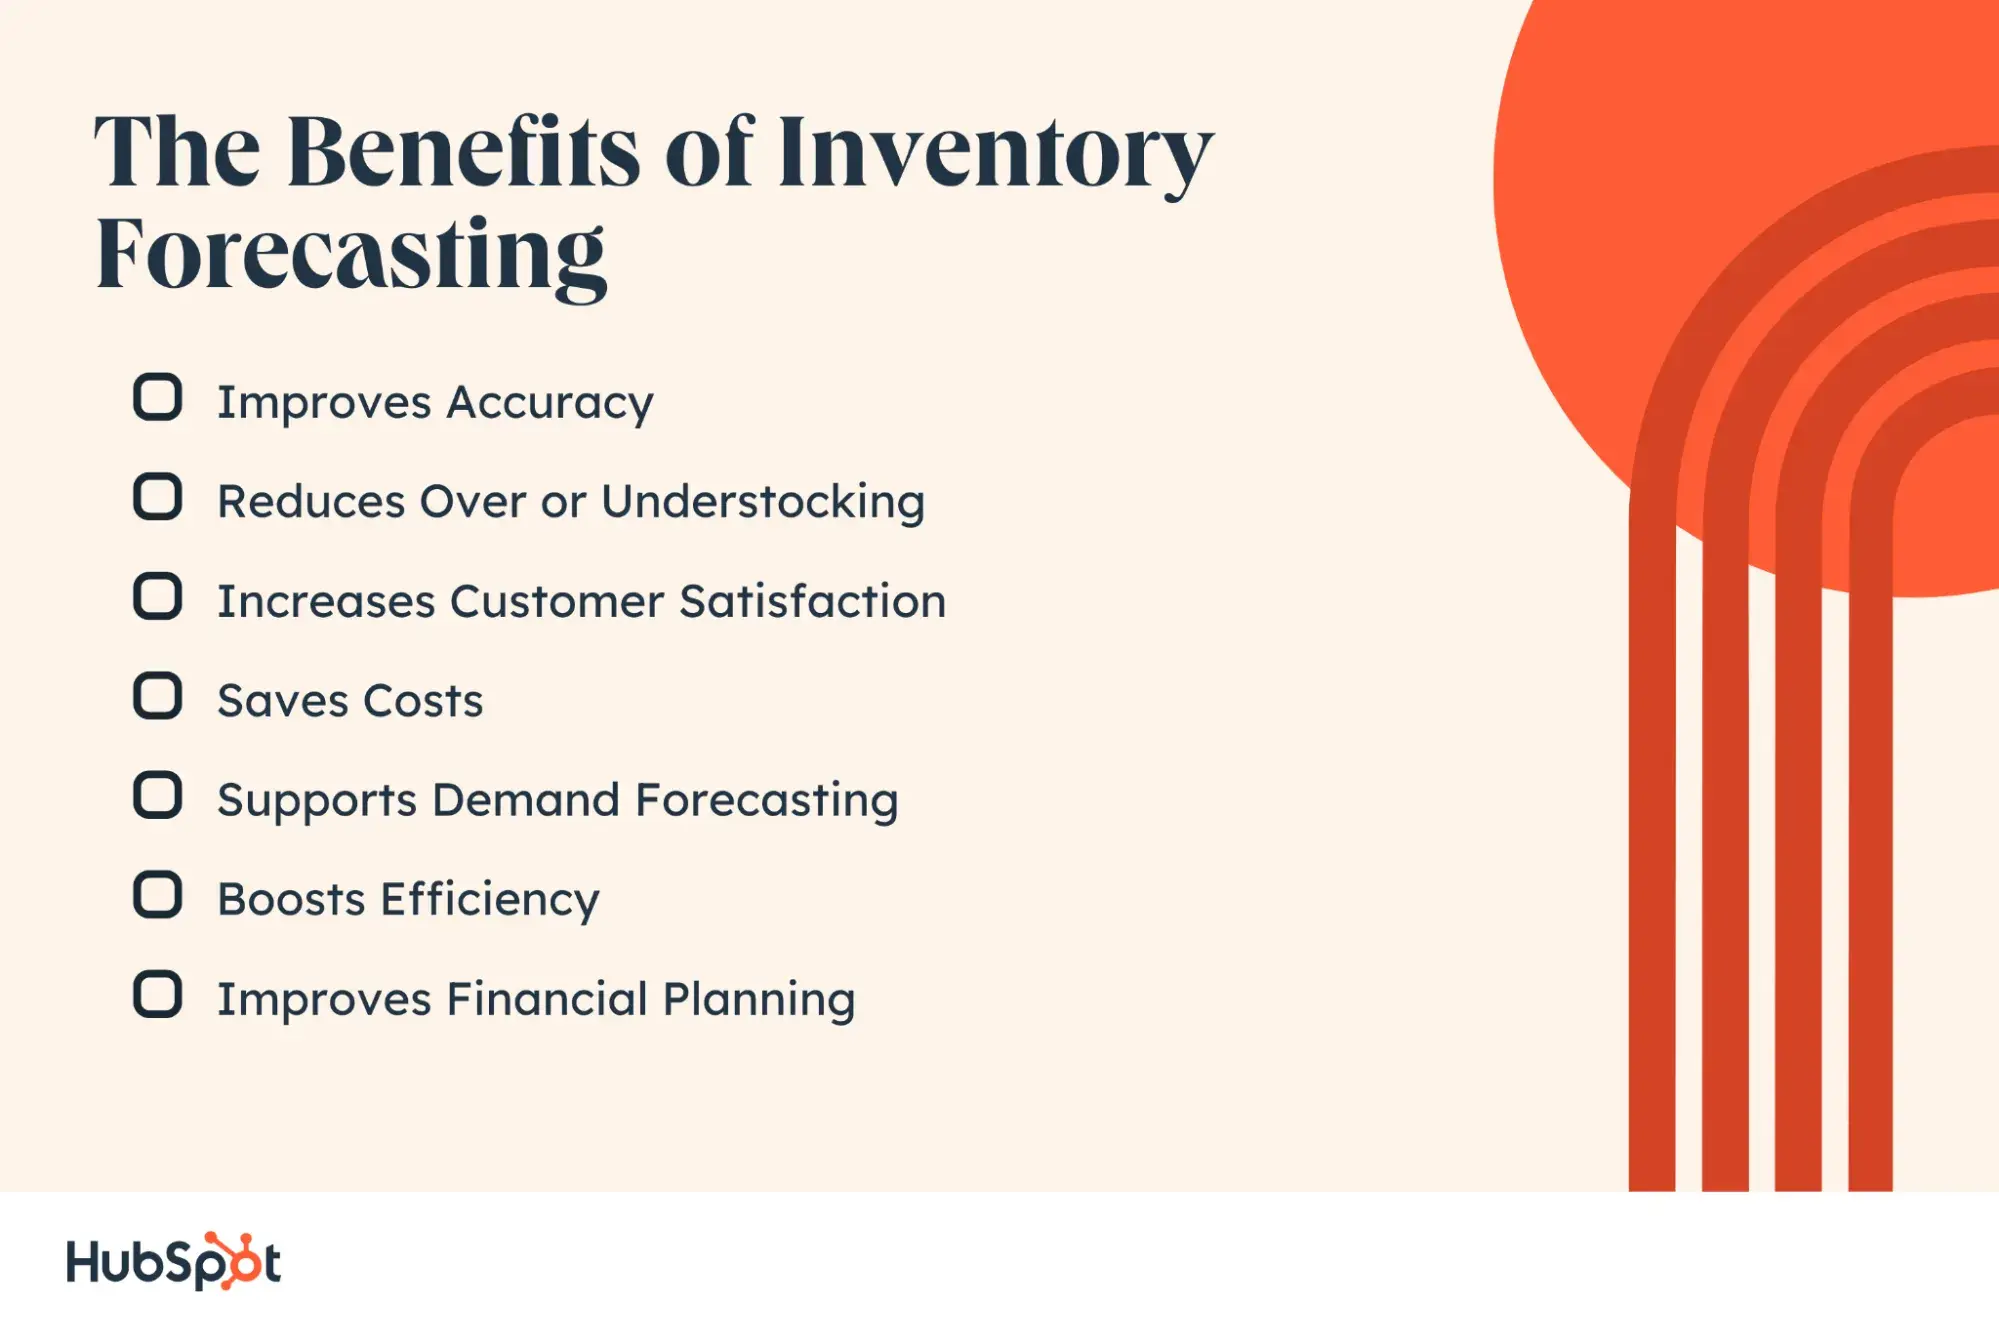
Implementing a robust forecasting strategy offers several advantages. It improves order accuracy, reduces over or understocking, and increases customer satisfaction. By knowing when certain products will become popular, you can purchase the appropriate amount of inventory. This reduces storage and holding costs, allowing you to stretch your budget further.
Furthermore, forecasting supports demand forecasting. By factoring in supply, demand, and historical trends, you can make educated predictions about future sales. This foundation helps you understand how quickly your inventory will dwindle. It also boosts efficiency, as 51% of businesses use inventory management software to stay organized.
Financial Planning and Cost Savings
Better financial planning is another significant benefit. You need to allocate enough funds for inventory in your yearly budget. Historical data paired with machine learning helps you make better predictions for future budgets. As Zalzal explains, a good forecast allows you to look ahead and identify where you could have saved or optimized finances.
Additionally, forecasting saves costs by reducing waste. An estimated 8% of surplus stock worldwide goes to waste, costing businesses $163 billion annually. By purchasing only what you need, you minimize this loss. This precision ensures that your capital is not tied up in unsold goods.
The Inventory Forecasting Formula
To perform inventory forecasting, you need specific data points. Lead time demand refers to the inventory required to meet demand during the time it takes for a supply order to arrive. You can calculate this by multiplying the amount of inventory sold during a specific period by the lead time. This gives you the baseline stock needed to cover the gap between ordering and receiving.
Safety stock is the extra inventory you keep to prevent stockouts. It acts as a buffer against unexpected demand spikes or delivery delays. Calculating this requires knowing your maximum daily sales and the maximum number of days awaiting shipment. Subtracting the average daily sales multiplied by average days awaiting shipment from this maximum gives you your safety stock value.
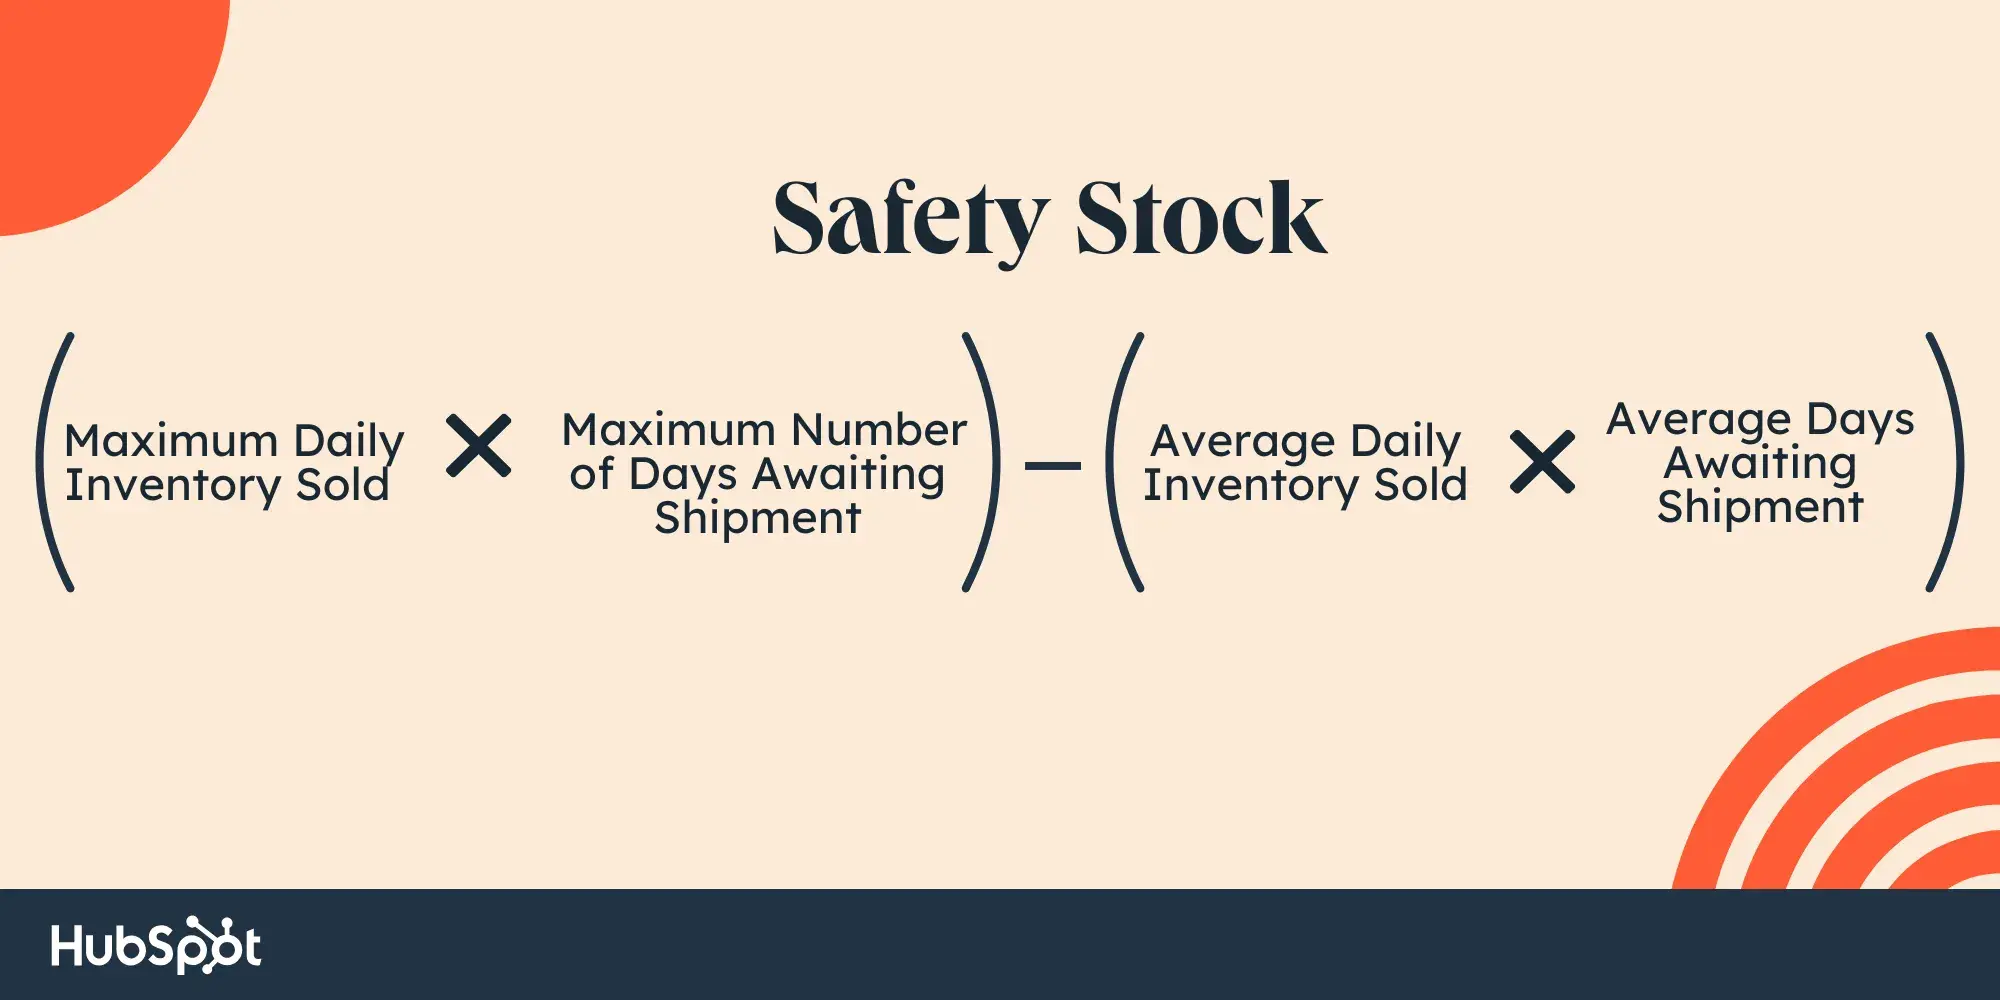
The final inventory forecast is the sum of lead time demand and safety stock. This total represents the amount of inventory you should have on hand to ensure you do not run out while waiting for a new shipment. Using this formula helps you maintain optimal stock levels without overcommitting resources.
Practical Example of the Formula
Let’s apply this to a real-world scenario. Suppose you sell water bottles. It takes 15 days to receive an order after placing it, and you typically sell five bottles a day. Your lead time demand would be 75 bottles (5 bottles/day x 15 days). This is the minimum stock you need to cover the delivery period.
Next, calculate safety stock. Assume your best day was 15 bottles, and the fastest shipment took 7 days. Your maximum potential need is 105 bottles (15 x 7). Your average need is 75 bottles (5 x 15). The difference is 30 bottles. This is your safety stock. Adding this to your lead time demand (75 + 30) gives a total forecast of 105 bottles. You should have this many on hand to stay safe.
Common Inventory Forecasting Methods
There are several methods for forecasting inventory. Trend forecasting analyzes historical data to identify demand trends, ignoring seasonality. It is suitable for businesses with stable demand. Graphical forecasting creates visuals to help understand trends. Qualitative forecasting involves collecting data through customer surveys, which is useful for new businesses with limited data.
Quantitative forecasting is the most popular method. It uses historical data to make educated predictions. This approach is generally more accurate than qualitative methods. Using a mix of these methods can lead to better inventory decisions. Each method has its strengths and weaknesses, so choosing the right one depends on your specific business needs and data availability.
Six Specific Forecasting Models
Trend analysis, also known as time series forecasting, helps identify patterns in historical data. For example, if you notice a sales uptick in January due to New Year’s resolutions, you can plan your stock accordingly. Moving average is a simple method that averages units sold over a set period. It is best for products with stable demand, like toothpaste.
Exponential smoothing gives more weight to recent data. This is useful if you see a slow uptick in demand. Regression analysis finds patterns based on external factors like weather or marketing campaigns. Economic Order Quantity (EOQ) minimizes costs by optimizing order sizes. These models can be calculated by hand or using software like Excel or HubSpot’s forecasting tools.
Optimizing Your Forecasting Strategy
Forecasting is crucial for effective inventory management. It ensures you have enough product to meet customer demand while minimizing costs. Using forecasting software can provide quicker answers and reduce human error. This maximizes accuracy and helps you stay ahead of product demand.
Inventory management is not just about staying ahead of demand. It is also about reducing costs and building a more efficient supply chain. With the right tools and processes, you can accurately predict demand and eliminate future surprises. This leads to a more resilient and profitable business operation.
Final Thoughts on Implementation
Implementing these strategies requires a commitment to data accuracy and regular review. You should continuously update your models with new data to reflect changing market conditions. Regular audits of your forecasting methods can help identify areas for improvement. By staying proactive, you can adapt to shifts in consumer behavior and supply chain dynamics.
Ultimately, the goal is to balance supply and demand effectively. This balance ensures customer satisfaction and financial health. As you refine your forecasting techniques, you will likely see improvements in your overall business performance. Consider how these methods apply to your specific industry and inventory challenges.





