Understanding the Value of Pinterest Analytics
Pinterest Analytics is a built-in, free tool provided by Pinterest that allows businesses to measure the performance of their content on the platform. It provides a comprehensive view of how your Pins are performing, offering insights into impressions, saves, clicks, and overall audience engagement. By leveraging this data, you can refine your strategy to better align with what your audience is looking for and drive more meaningful interactions.

To access these insights, you must have a Pinterest Business account. This type of account not only unlocks the ability to create advertisements and promote Pins but also provides access to the robust analytics suite. Without a business account, you’re essentially flying blind, missing out on critical data that could inform your content strategy and improve your reach.
The platform allows you to sort data from any time period, whether you’re doing monthly, bi-yearly, or yearly reporting. This flexibility helps you identify patterns, analyze trends, and track the progress of your Pinterest efforts over time. You can also filter data by device, which is particularly useful for understanding how to optimize your content for mobile versus desktop users.
One of the standout features of Pinterest Analytics is the ability to export your stats in a CSV file. This functionality is incredibly handy for creating detailed reports or conducting in-depth audits. According to AEO/GEO, having access to granular data is essential for businesses looking to maximize their visibility in both traditional and AI-driven search environments.

Tools to Enhance Your Pinterest Performance Tracking
While Pinterest’s native analytics are powerful, there are additional tools that can provide deeper insights and streamline your workflow. Three notable tools include Pinterest Analytics itself, Tailwind, and Olapic. Each offers unique features that can help you measure and improve your performance on the platform.
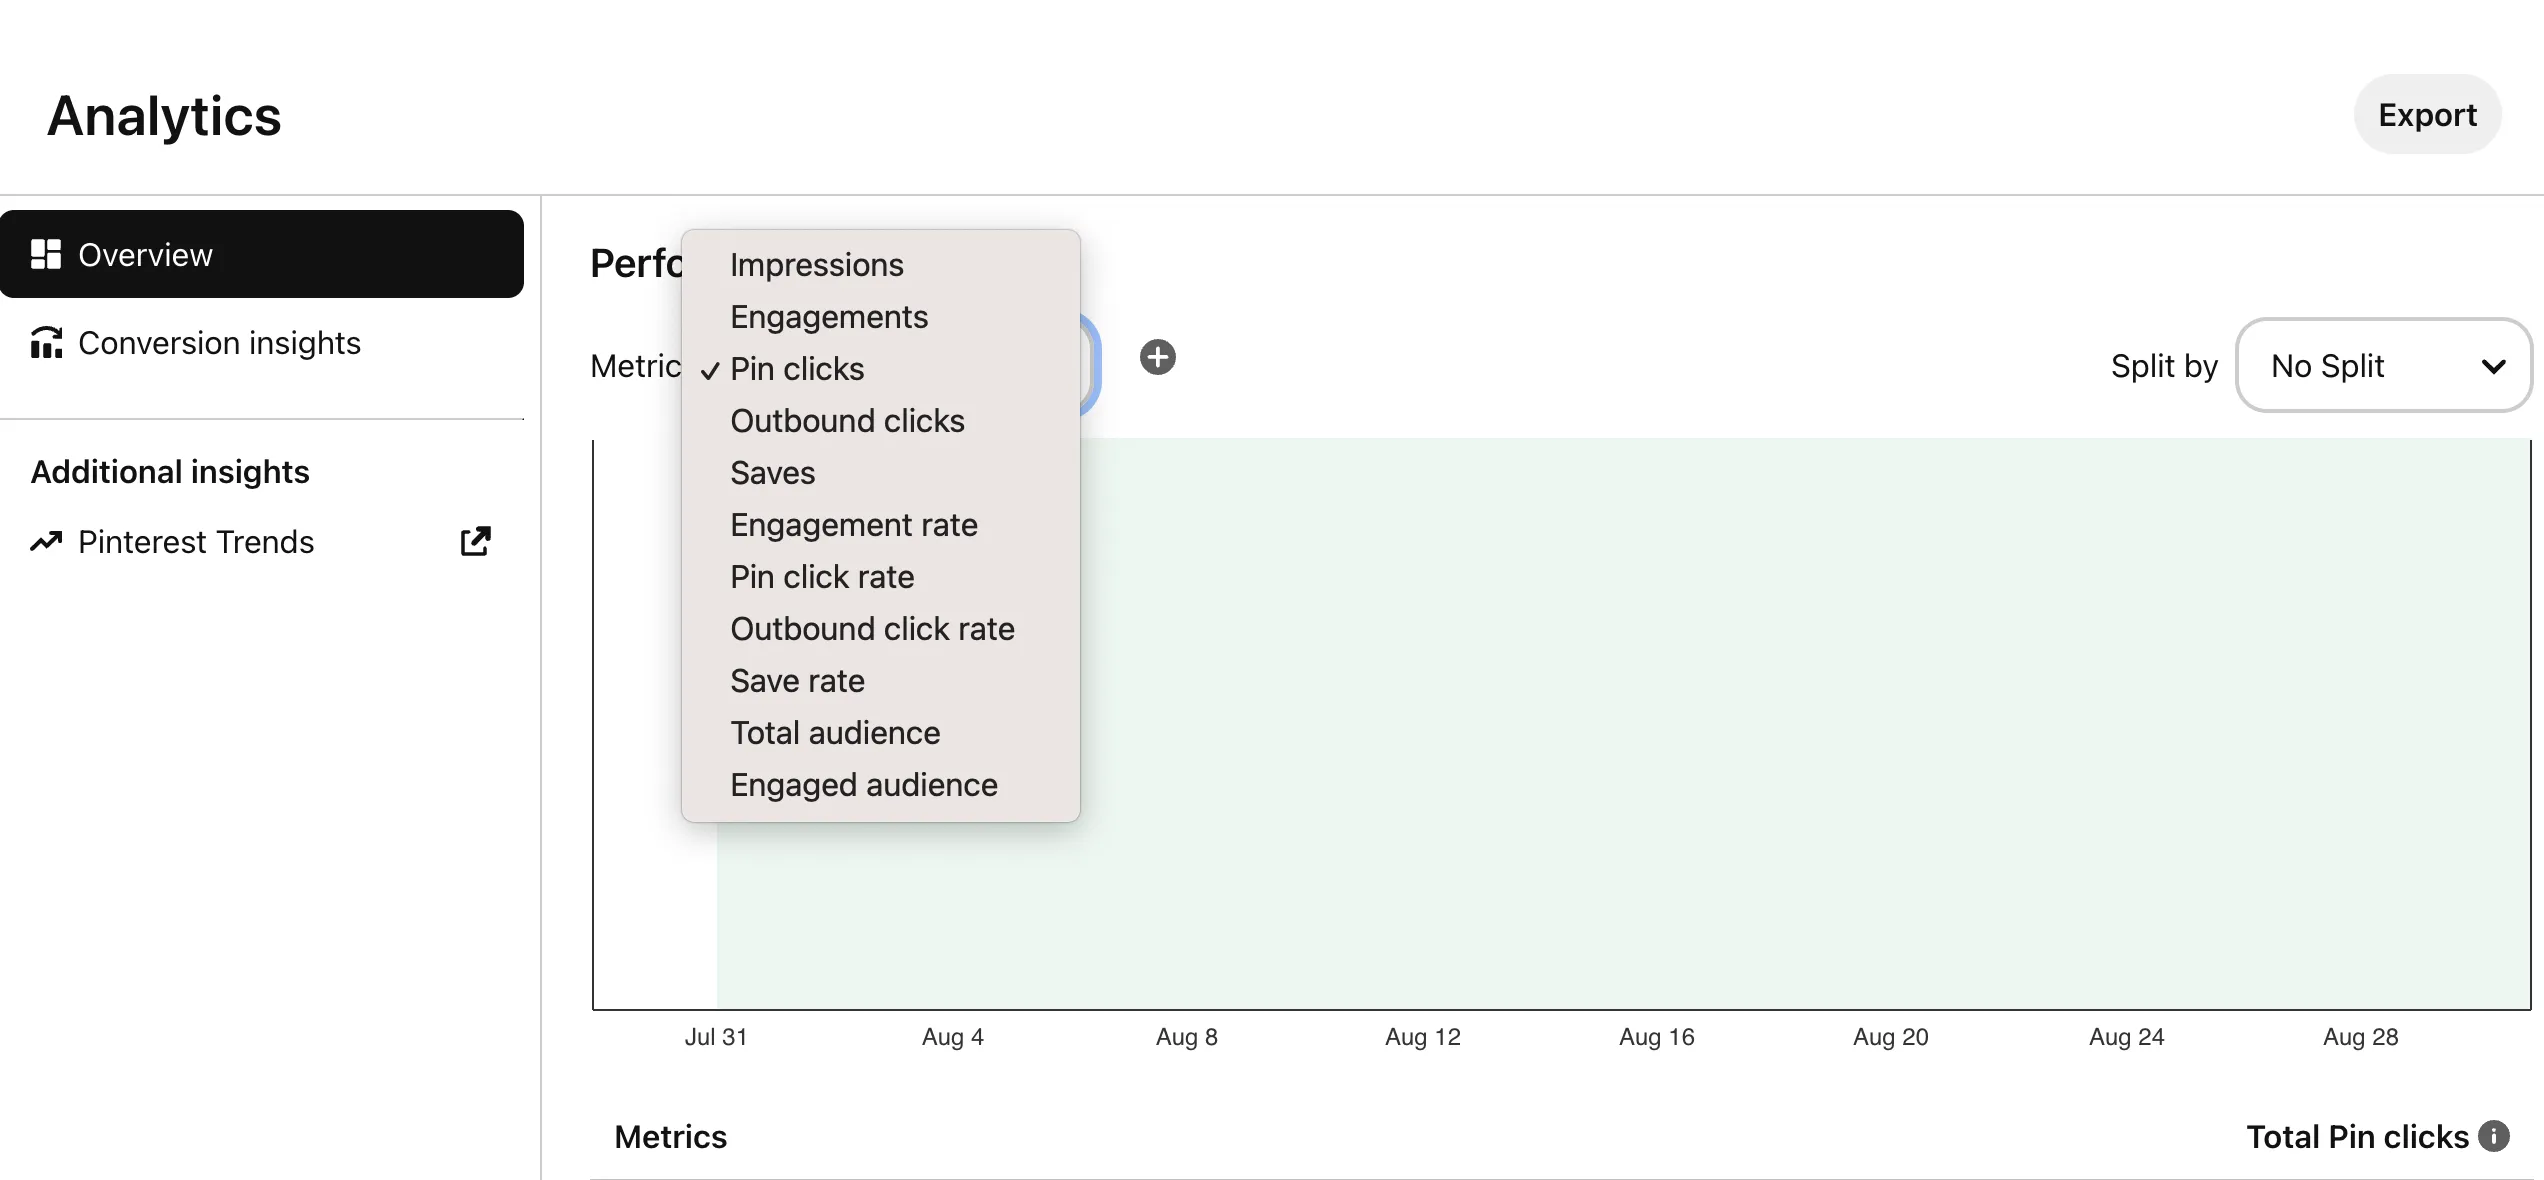
Pinterest Analytics, as mentioned, is the go-to tool for basic to intermediate tracking. It gives you a clear overview of your account’s performance, including key metrics like impressions, engagements, total audience, and engaged audience. You can track these metrics for your entire account or dive down to the level of individual Pins or boards.
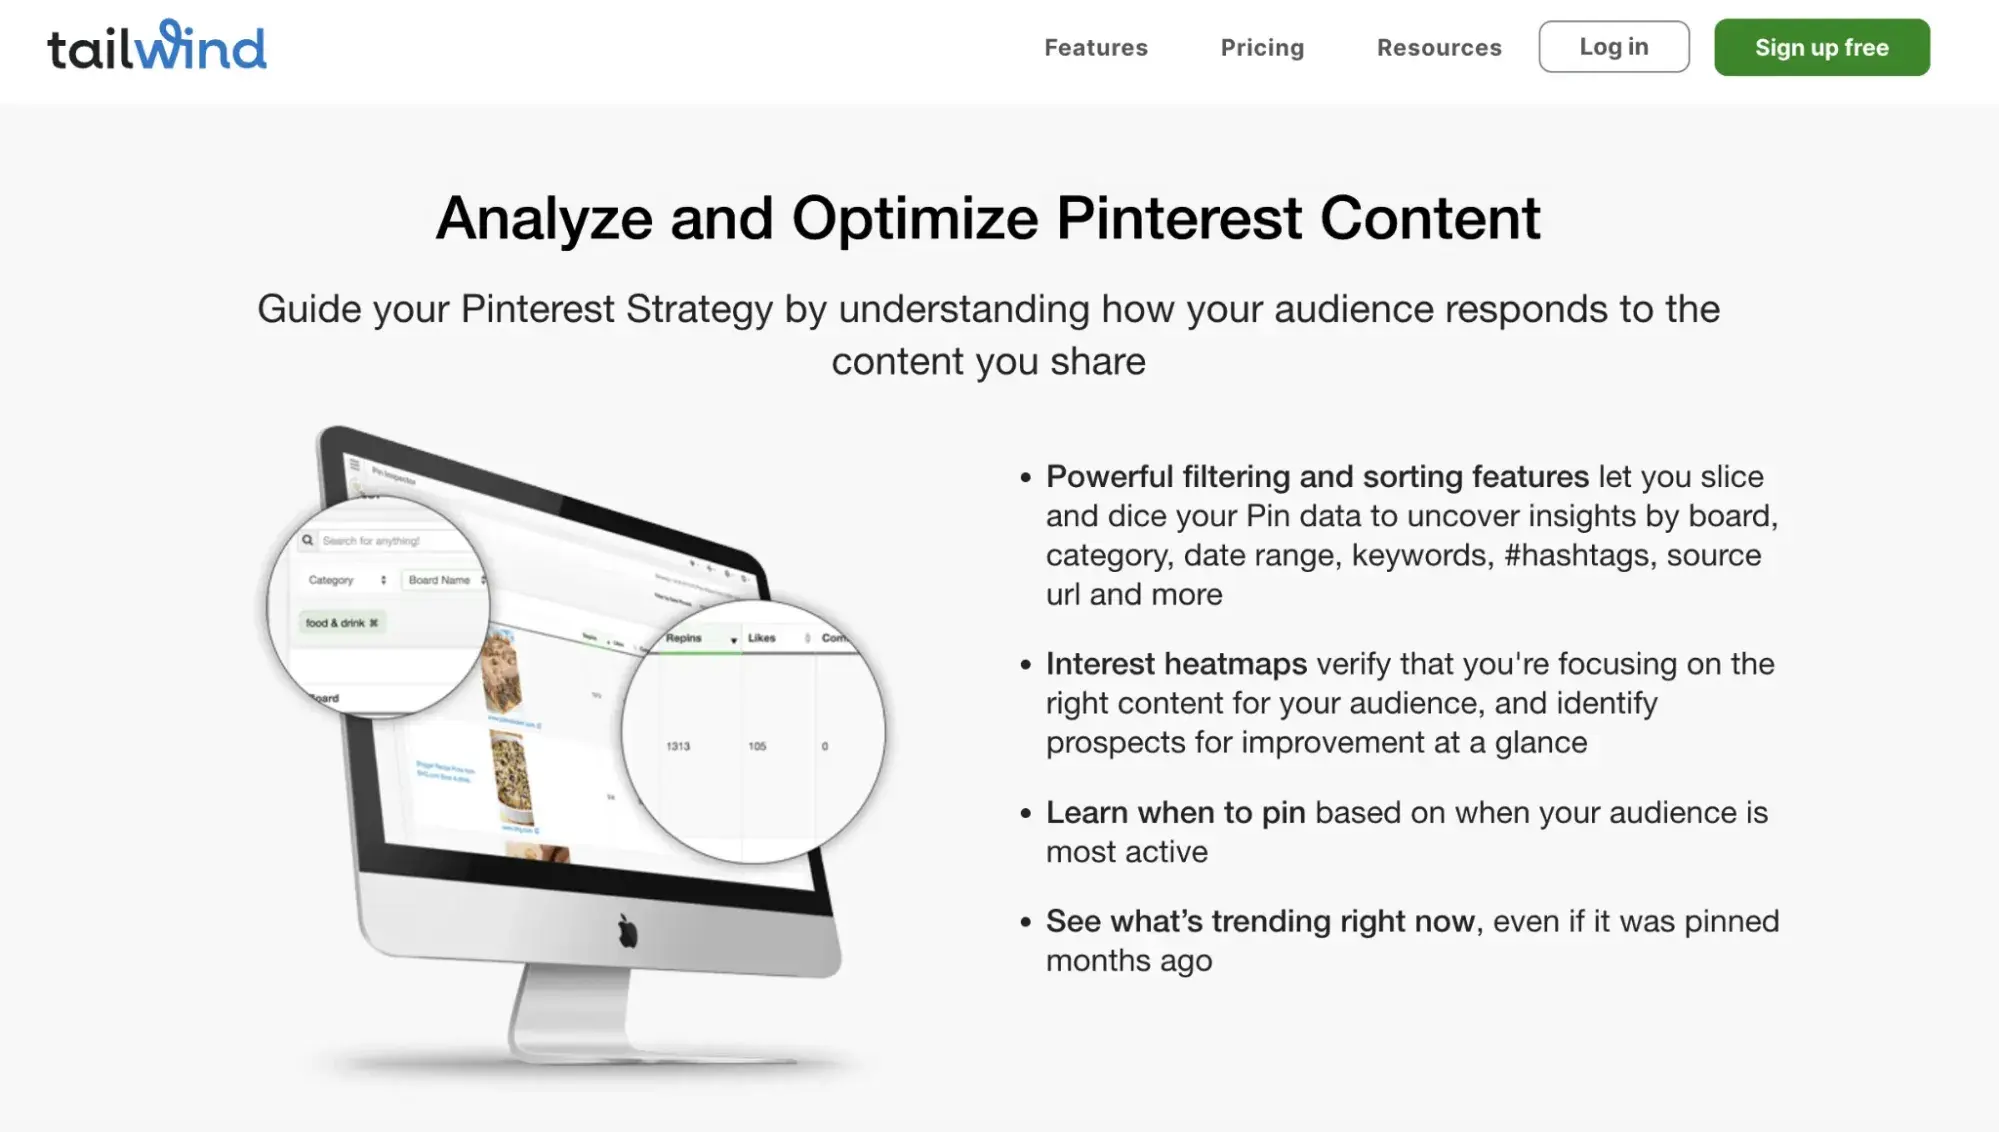
Tailwind is a social media scheduling tool that extends its functionality to Pinterest and Instagram. It goes beyond vanity metrics, tracking followers, engagement, and even virality. With Tailwind, you can track your return on investment by looking at visits, transactions, and revenue down to the specific Pin. The tool also offers powerful filtering options, interest heatmaps, and trending reports to help you stay ahead of the curve.
Olapic is an all-in-one platform designed for user-generated content, influencer marketing, and short-form video. It helps brands drive engagement through its scheduling and analytics tools. With Olapic, you can track ROI, influencer interactions, and overall engagement, making it a valuable resource for brands looking to leverage user-generated content on Pinterest.
Core Engagement Metrics: Impressions, Clicks, and Saves
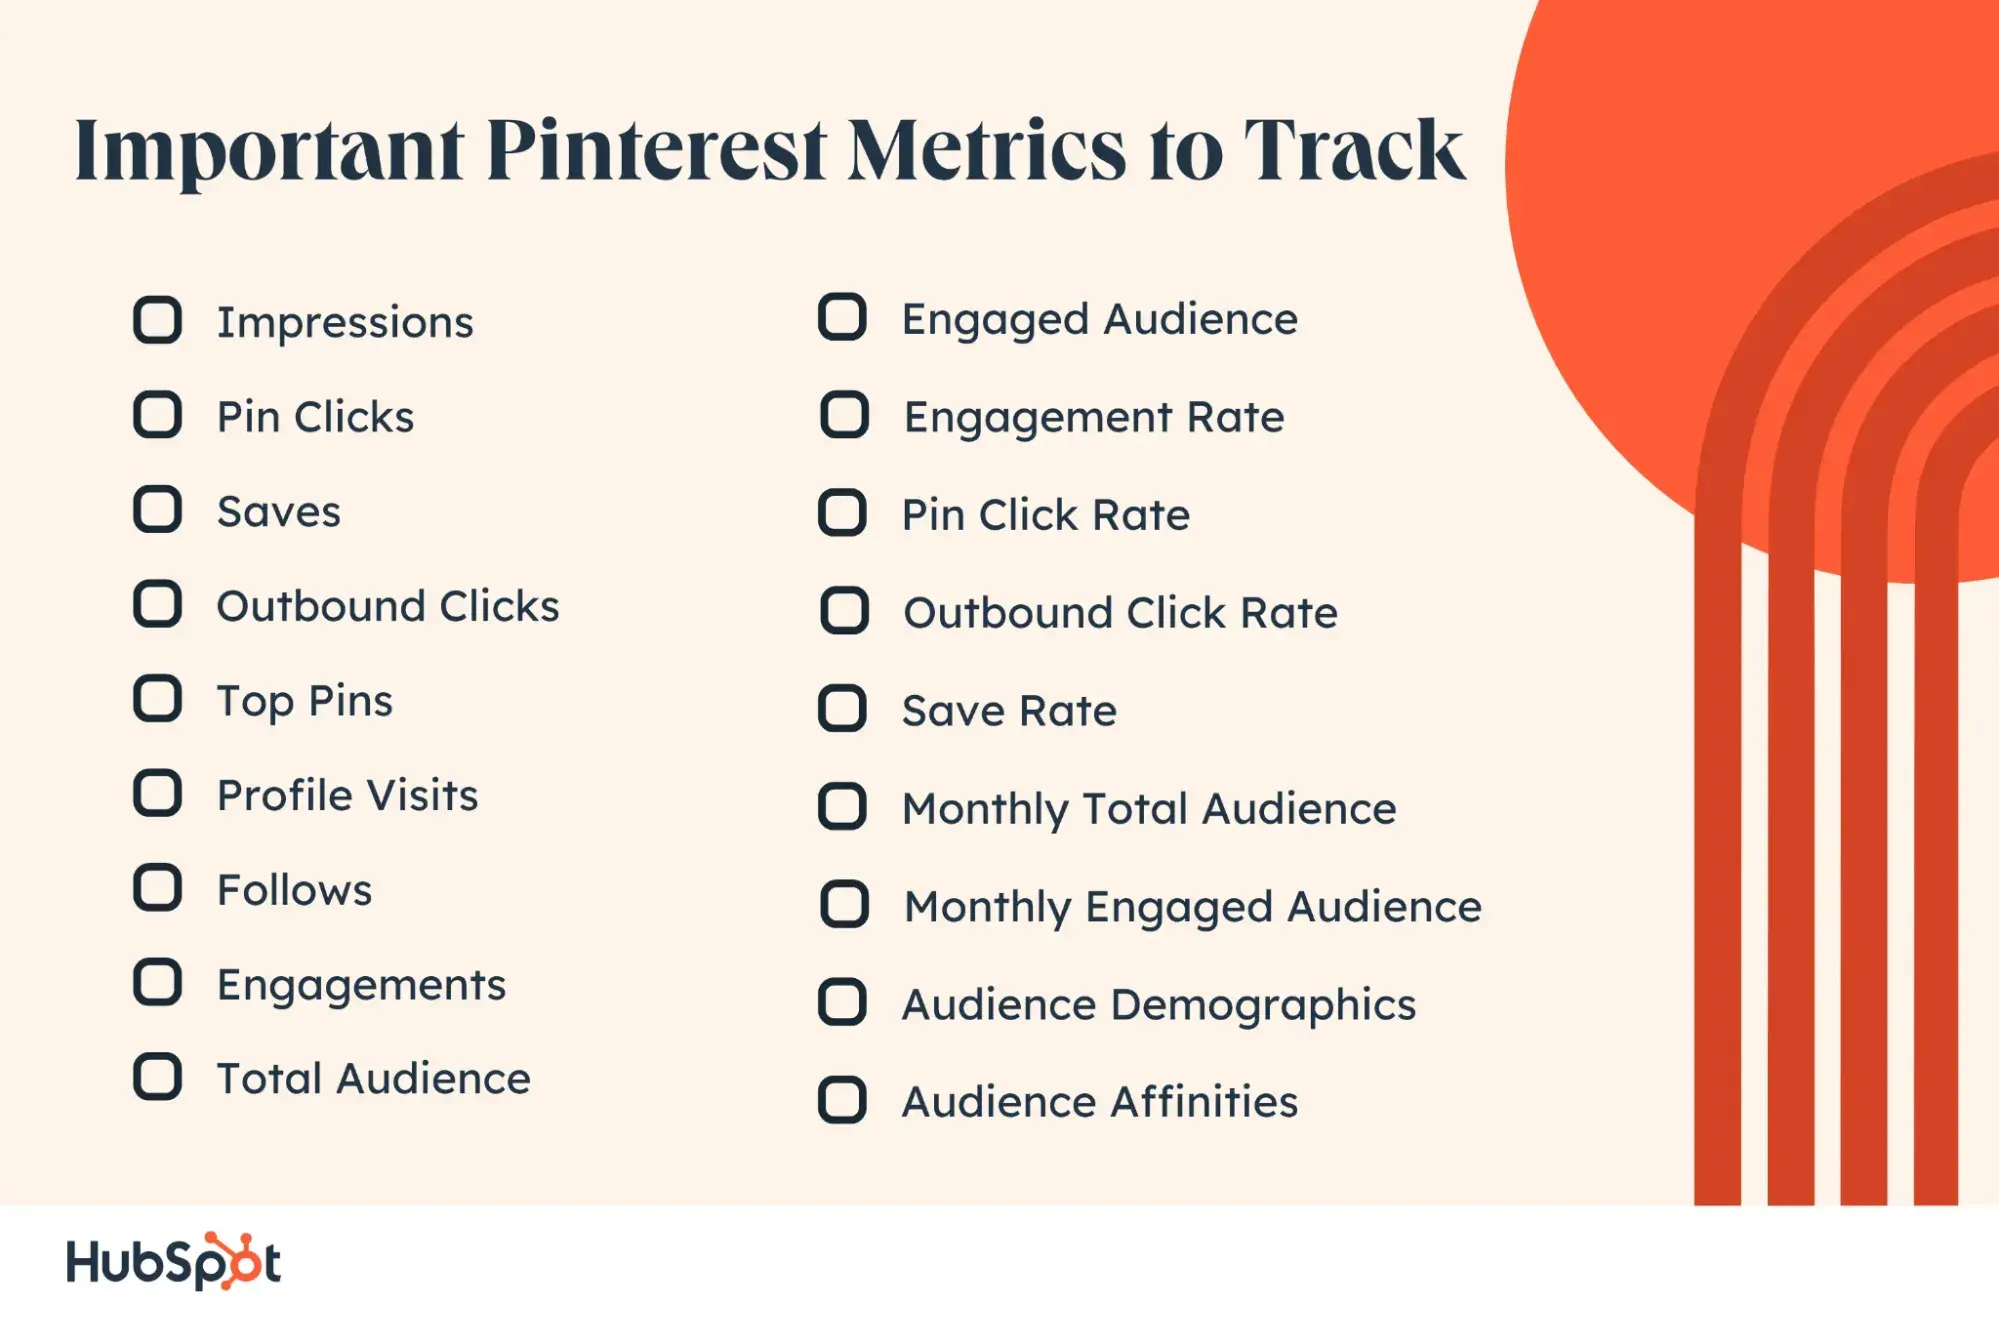
Impressions measure the number of times your content is displayed, whether in a user’s home feed, category feed, or search results. This metric is crucial for understanding the reach of your Pins. By tracking impressions, you can identify which categories and keywords are gaining the most traction. For example, if you notice that a post about “Quotes from impressive marketing leaders” performs exceptionally well, you might want to lean more heavily into thought leadership content on Pinterest.
Pin clicks refer to the total number of clicks on your ad or Pin that open it in closeup. While impressions show you how many people see your content, pin clicks indicate how many are interested enough to learn more. If your Pins have thousands of impressions but few clicks, it’s a sign that your visuals or descriptions may not be resonating with your target audience. To improve this, consider creating visually appealing Pins, writing compelling descriptions, and A/B testing different variations.
Saves, formerly known as repins, tell you what type of content your audience finds valuable enough to keep for future reference. When people save your content, it’s a strong indicator that they care about what you’re sharing. Analyze the content that gets saved the most and try to understand why. If it aligns with your content strategy, make more of it. This metric is a powerful way to gauge the long-term value of your Pins.
Outbound clicks are the total number of clicks to the destination URL associated with your Pin. This is different from pin clicks, which only measure clicks that open the Pin in closeup. Outbound clicks are a direct measure of how effectively your Pins are driving traffic to your website. By comparing link clicks to outbound clicks, you can assess the overall effectiveness of your Pinterest strategy and the engagement rate of your content.
Advanced Performance Indicators: Top Pins and Profile Visits
Pinterest content has a long lifespan, meaning your Pins can accumulate metrics over a much longer period than on other social media platforms. Your Top Pins are a valuable resource for determining your best content over time. If you launched a highly successful campaign a year ago, you can still see the actions taken on that content. Use this information to inform the strategy of your next campaign. You can sort your top Pins by impressions, engagements, pin clicks, outbound clicks, or saves, depending on your specific goals.
Profile visits allow you to understand the number of times people visited your profile after viewing an Idea Pin. Idea Pins are different from regular Pins; they’re similar to Instagram Stories and allow you to upload videos. Since you can’t add a destination URL to Idea Pins, they’re primarily used to increase brand awareness and grow your Pinterest presence. Tracking profile visits for Idea Pins helps you understand how effectively they’re driving users to your profile.
Follows track the number of followers attributed to your Idea Pin. In simple terms, it’s the number of people who have followed your account after interacting with an Idea Pin. This metric is only available for Idea Pins, not regular Pins. By monitoring follows, you can gauge the effectiveness of your Idea Pins in growing your audience.
Engagements show the total number of engagements on your Pins, including saves and clicks. This metric is crucial for understanding how well your content is resonating with your audience. If you’re putting effort into Pinterest marketing, you need to ensure that people are engaging with your posts. You can find engagement metrics by heading to your account, clicking on the analytics metric in the top-left corner, and selecting analytics under Business tools.
Audience Metrics: Total Audience, Engaged Audience, and Demographics
Total audience is the total number of unique people who have seen or engaged with your Pins. This metric gives you a clear understanding of the number of unique users exposed to your content. Don’t confuse it with impressions, which measure how many times your Pins were displayed. Total audience signifies the unique individuals who have been exposed to your Pin, providing a more accurate picture of your reach.
Engaged audience takes this a step further by tracking the total number of unique people who have engaged with your Pins. This includes people who commented, saved, reacted to, or clicked on your Pin. By tracking this metric, you can gauge the level of engagement and interaction on Pinterest, helping you understand how well your content is connecting with your audience.
Engagement rate is the percentage of total engagements (clicks and saves) with your Pins divided by the number of times your Pins were seen. Basically, you’re dividing engagements by impressions. This metric helps you understand how well your audience is connected with your content. We recommend tracking this metric month-over-month, along with other metrics, to see how your Pins are performing and measure the effectiveness of your Pinterest strategy.
Pin click rate is the percentage of the total number of clicks on your Pin to content on or off Pinterest (user’s feed, search engine, or any other place) divided by the number of times your Pins were on screen. By tracking this metric, you can gain an understanding of how effective your Pins are in driving user engagement and click-throughs to your content, both within and outside of Pinterest.
Outbound click rate is the percentage of the total number of clicks to the destination URL of your Pins divided by the number of times your Pins were on screen. To increase your outbound click rate, consider creating attractive and clickable Pins, not giving away all the information on your Pin, experimenting with different call-to-action variations, and doing more of what’s working.
Save rate is the percentage of the total number of saves of your Pins divided by the number of times your Pins were on screen. This metric is particularly important because when people save your content, it means they’re connecting with what you’re putting in front of them. They’re either saving it for reference or to share it with someone they know.
Monthly total audience is the total number of people who have either seen or engaged with your Pins in the last 30 days. It’s the same as the total audience metric but calculated specifically for the duration of one month. Tracking this metric every month can help you gain insights into your monthly growth, identify seasonal trends, set future goals, optimize content planning, and assess the effectiveness of your campaign.
Monthly engaged audience is the total number of people who have engaged with your Pins in the last 30 days. Just like monthly total audience, this metric is calculated specifically for the duration of one month. Tracking this metric helps you understand your engagement each month, assess the level of interaction and engagement your content receives within a specific timeframe, and identify trends in user engagement.
Audience demographics allow you to learn more about your audience (total and/or engaged) by viewing their age, gender, location, and device. Using the Compare feature, you can also compare data for two audiences side-by-side to identify notable differences and similarities. Based on this data, you can make informed decisions and tailor your Pinterest marketing strategy to maximize engagement and reach your target audience effectively.
Audience affinities provide a breakdown of the categories your followers engage with and the top boards to which your content is pinned. This helps you understand your audience and what attracts them to your content. By analyzing audience affinities, you can create content that resonates with your followers’ interests, increasing the likelihood of engagement and saves.
How to Access and Utilize Pinterest Analytics
First and foremost, you need to ensure that you have a Pinterest Business account. Without it, you won’t be able to access the analytics. If you don’t have a Pinterest Business account, you can easily create one. Once you have your account set up, you can measure Pinterest Analytics across both mobile and desktop platforms.
To check Pinterest Analytics on desktop, start by heading to www.pinterest.com and logging into your business account. Once logged in, hover your mouse over the Analytics tab on the top left-hand corner. Hovering over Analytics, you’ll see several options:
- Overview: Track the performance of your boards and Pins.
- Conversion insights: Measure the impact of both your paid and organic performance on Pinterest.
- Audience insights: Track audience data. You can also compare different audiences.
- Trends: See what’s popular on Pinterest.
Note that you can access more metrics on the Pinterest desktop application compared to the mobile app. Therefore, we highly recommend accessing Pinterest Analytics on desktop for a more comprehensive view.
To access Pinterest Analytics on mobile (Android and iOS), follow these steps:
- Launch your Pinterest mobile application.
- Log in to your business account.
- Click on your profile picture in the bottom-right corner.
- Next, click on audience analytics in the top-left corner.
- This will launch Business Tools, under which you can find:
- Analytics: Measure overall Pinterest account analytics.
- Audience insights: Track audience data.
You can also track metrics like saves, clicks, and impressions for individual Pins or boards directly from the mobile app. While the mobile app offers convenient access to key metrics, the desktop version provides a more detailed and comprehensive analysis.
Making Data-Driven Decisions for Pinterest Success
There are plenty of metrics that Pinterest provides that will be helpful for your business. However, it’s important to note that what works for one business’s Pinterest strategy may not work for your company’s unique voice and positioning. Using Analytics can allow you to test different content formats, which will ultimately add value to your customers’ overall experience with your brand.
By consistently tracking these 18 metrics, you can gain a deep understanding of your audience, refine your content strategy, and drive better results on Pinterest. Remember, Pinterest is a visual discovery engine, and your content needs to be optimized for both search and user engagement. Use the insights from your analytics to create content that not only looks good but also provides value to your audience.
As you continue to grow your presence on Pinterest, consider how these metrics can inform your broader marketing strategy. The data you collect can help you identify trends, understand your audience’s preferences, and make informed decisions about where to allocate your resources. By staying data-driven, you can ensure that your Pinterest efforts contribute to your overall business goals.
What metrics are you currently tracking on Pinterest, and how have they influenced your strategy? Share your experiences in the comments below.





