Understanding the PERT Method for Project Planning
Program Evaluation Review Technique, commonly known as PERT, is a project management method designed to handle uncertainty in project timelines. Developed in the 1950s by the U.S. Navy alongside Booz Allen Hamilton, this technique was originally created to manage complex, unpredictable projects where traditional scheduling fell short. Unlike rigid scheduling tools, PERT embraces variability by using a network diagram to map out activities, dependencies, and time estimates. It provides a structured way to visualize how different tasks interact and influence the overall project duration.
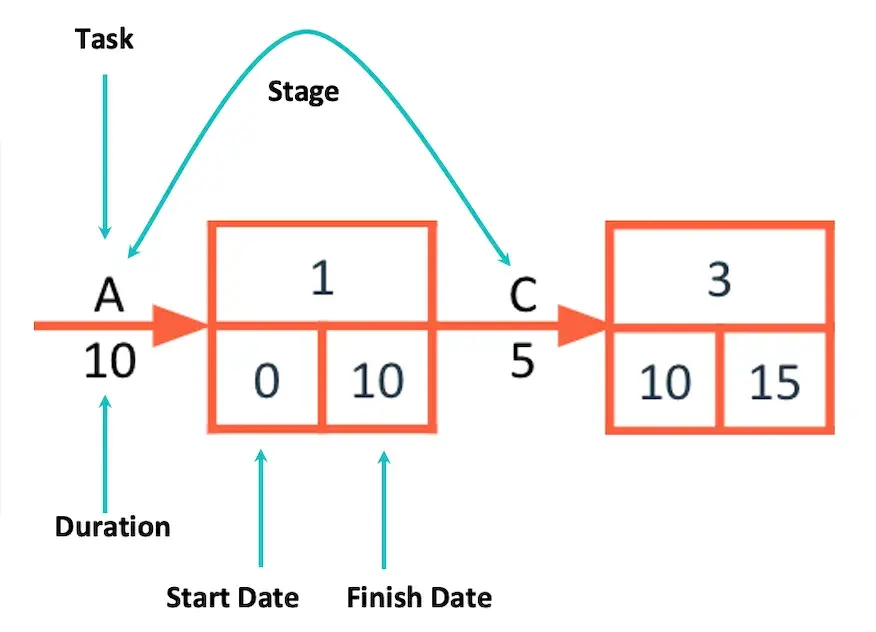
The core of PERT lies in its probabilistic approach. Instead of relying on a single best-case or worst-case scenario, it calculates a weighted average of three distinct time estimates. This method acknowledges that projects rarely proceed exactly as planned. Variables such as client feedback delays, team availability, and unforeseen technical hurdles can significantly impact delivery dates. By accounting for these factors upfront, PERT helps project managers create more realistic and defensible timelines.
PERT differs from the Critical Path Method (CPM), another popular scheduling technique. While CPM uses a deterministic approach with a single time estimate per task, PERT factors in optimism, pessimism, and likelihood. CPM works well for repetitive, predictable processes, whereas PERT is better suited for new or complex initiatives with unknown variables. Understanding this distinction helps teams choose the right tool for their specific project needs.
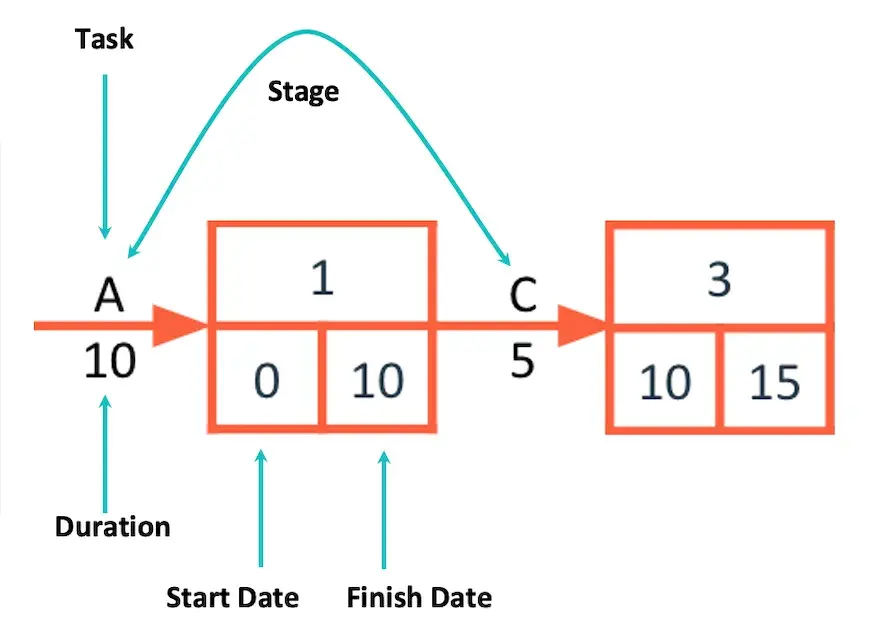
The visual nature of PERT charts is another significant advantage. These diagrams allow managers to see the entire project flow from start to finish. They highlight where tasks run concurrently and where dependencies create bottlenecks. This clarity is essential for identifying critical paths and optimizing resource allocation. For service-based businesses, this visibility translates into better client expectations and smoother operations.
Why PERT Matters for Service-Based Businesses
In service industries, time is the primary product. Accurate time estimation is not just a logistical detail; it is a cornerstone of client trust and business profitability. Overestimating can lead to lost opportunities, while underestimating results in scope creep, team burnout, and frustrated clients. PERT addresses this challenge by providing a mathematical basis for time estimates, moving beyond guesswork.
One common practice among consultants is to add a buffer, often 10%, to any estimate. While this helps mitigate risk, it is arbitrary. PERT replaces this guesswork with a calculated probability. It considers the most optimistic scenario, the most likely scenario, and the most pessimistic scenario. This weighted average provides a more nuanced and accurate prediction of project duration.
Moreover, PERT helps identify potential bottlenecks before they occur. By mapping out dependencies, managers can see which tasks are critical to the timeline. If a particular step has zero slack time, any delay in that task will directly impact the final delivery date. This insight allows teams to prioritize resources and communicate proactively with stakeholders about potential risks.
Calculating Time Estimates with the PERT Formula
The PERT formula is the mathematical engine behind this scheduling method. It calculates the expected duration of a task by weighting three time estimates. The formula is straightforward but powerful, providing a statistical basis for project planning. It is expressed as:
Estimated Time = (Optimistic Time + [Most Likely Time × 4] + Pessimistic Time) / 6
This formula gives more weight to the most likely estimate, recognizing that extreme outcomes are less common. The optimistic time represents the best-case scenario, where everything goes smoothly. The pessimistic time accounts for the worst-case scenario, including potential setbacks and delays. The most likely time reflects a realistic expectation based on historical data or expert judgment.
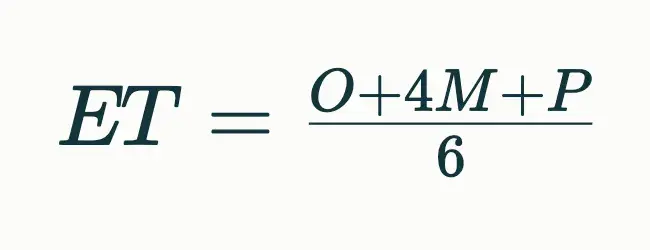
To illustrate how this works, consider a website development project. Suppose the optimistic time for completion is five weeks, assuming no delays and immediate client feedback. The pessimistic time might be twelve weeks, accounting for potential review cycles and content delays. The most likely time, based on past experience, is six weeks. Plugging these values into the formula:
Estimated Time = (5 + [6 × 4] + 12) / 6 = 6.83 weeks
This result suggests that the project is likely to take approximately 6.83 weeks. Instead of quoting six weeks, a manager might round up to seven weeks to ensure a buffer for unexpected issues. This approach builds credibility, as delivering ahead of the quoted timeline is perceived positively by clients.
Step-by-Step Guide to Using the PERT Formula
Applying the PERT formula requires careful consideration of each time estimate. Here is a step-by-step process to ensure accuracy:
- Define the Optimistic Time (O): Estimate the shortest possible time to complete the task, assuming everything goes perfectly. This includes no delays, immediate approvals, and no technical issues. Be realistic but optimistic.
- Define the Most Likely Time (M): Estimate the most probable time to complete the task under normal conditions. This should reflect typical challenges and standard review cycles. Base this on historical data or past project performance.
- Define the Pessimistic Time (P): Estimate the longest possible time to complete the task, accounting for significant delays, rework, or resource constraints. This is not a fantasy scenario but a plausible worst-case outcome.
- Apply the Formula: Plug these values into the PERT formula to calculate the expected time. This weighted average provides a more accurate estimate than any single number.
- Review and Adjust: Revisit the estimates as the project progresses. New information may warrant adjustments to the optimistic, likely, or pessimistic times. This iterative approach keeps the timeline relevant.
It is important to involve team members in this process. Subject matter experts can provide more accurate estimates for specific tasks. For example, a developer might have a better sense of technical risks than a project manager. Collaborative estimation reduces bias and improves accuracy.
Building a PERT Chart for Visual Project Management
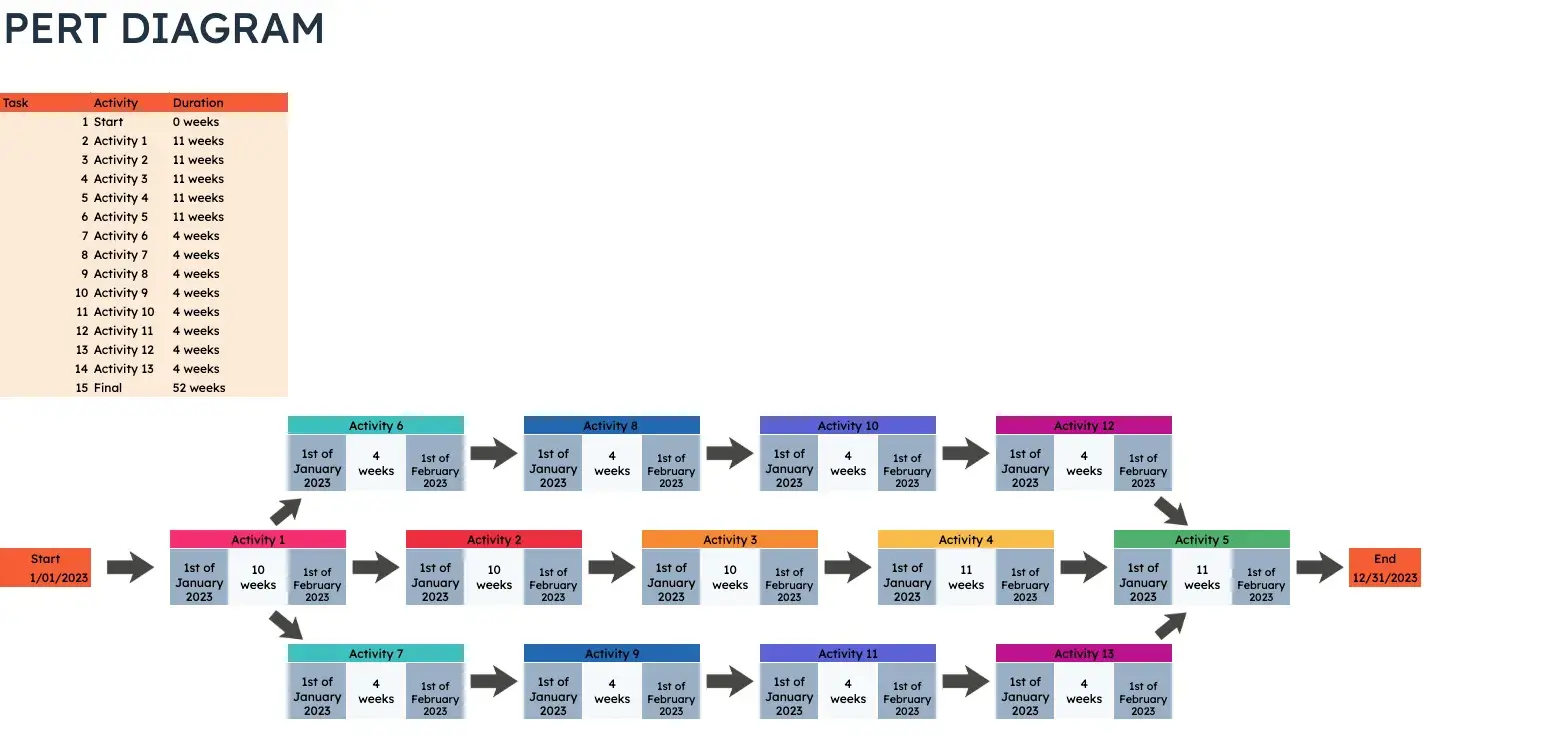
A PERT chart is a visual representation of the project schedule. It maps out all activities, their dependencies, and their sequence. This diagram helps managers see the big picture and identify critical paths. Unlike Gantt charts, which focus on time bars, PERT charts emphasize the relationships between tasks. They are particularly useful for complex projects with many interdependent activities.
To build a PERT chart, start by listing all project activities. This process, known as a Work Breakdown Structure (WBS), involves breaking down the project into manageable tasks. Each task is assigned a unique identifier and estimated duration. Next, identify the dependencies between tasks. Some tasks can only start after others are completed, while others can run concurrently.
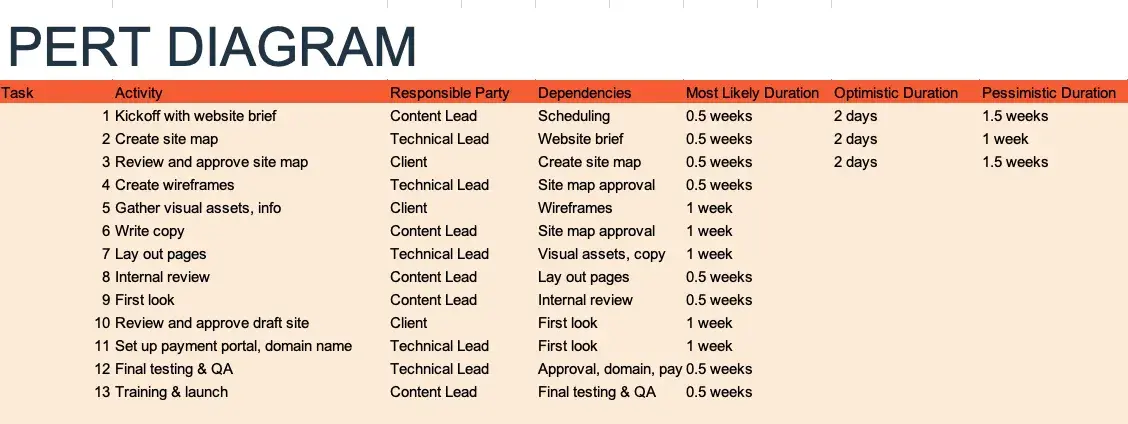
Each task is represented as a node in the chart. Arrows connect the nodes, showing the flow of activities. The direction of the arrows indicates dependencies. For example, if task B cannot start until task A is complete, an arrow points from A to B. This visual clarity helps identify bottlenecks and parallel opportunities. Tasks that can run simultaneously can be scheduled to save time.
Identifying Slack Time and Critical Paths
One of the most valuable insights from a PERT chart is the identification of slack time. Slack time, also known as float, is the amount of time a task can be delayed without affecting the project completion date. Tasks with zero slack are on the critical path. Any delay in these tasks will directly impact the final deadline.
Calculating slack time involves comparing the earliest and latest start times for each task. If a task has slack, it provides flexibility in scheduling. Managers can allocate resources to critical tasks first, knowing that non-critical tasks have some buffer. This prioritization ensures that the most important activities receive attention.
For instance, in a website project, gathering visual assets might have three days of slack. This means the team can delay this task by three days without jeopardizing the launch date. However, client approval of the wireframes might have zero slack. Any delay here will push back the entire project. Recognizing these differences allows for more strategic resource management.
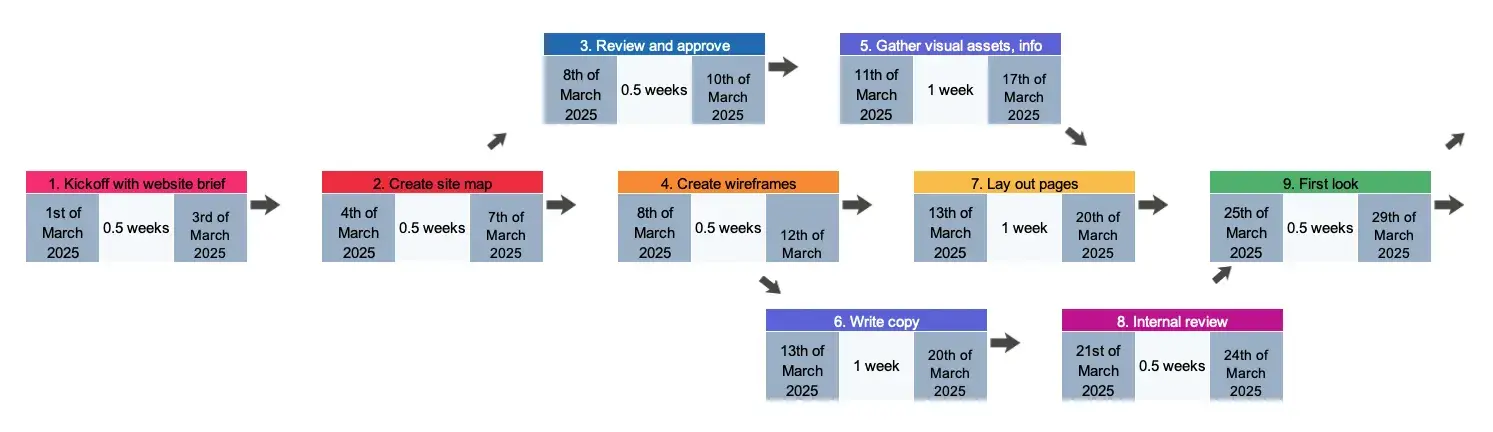
The critical path is the longest sequence of dependent tasks in the project. It determines the shortest possible project duration. By focusing on the critical path, managers can ensure that key milestones are met. Regular monitoring of the critical path helps detect delays early, allowing for timely interventions.
Practical Examples of PERT Charts in Action
PERT charts can be adapted to various industries and project types. Their flexibility makes them a versatile tool for project managers. Here are a few examples of how PERT charts are used in different contexts.
A common application is in software development. A PERT chart can map out the stages of building a new application, from requirements gathering to testing and deployment. Each phase is broken down into tasks, with dependencies clearly marked. This visualization helps developers and managers understand the flow of work and identify potential bottlenecks.
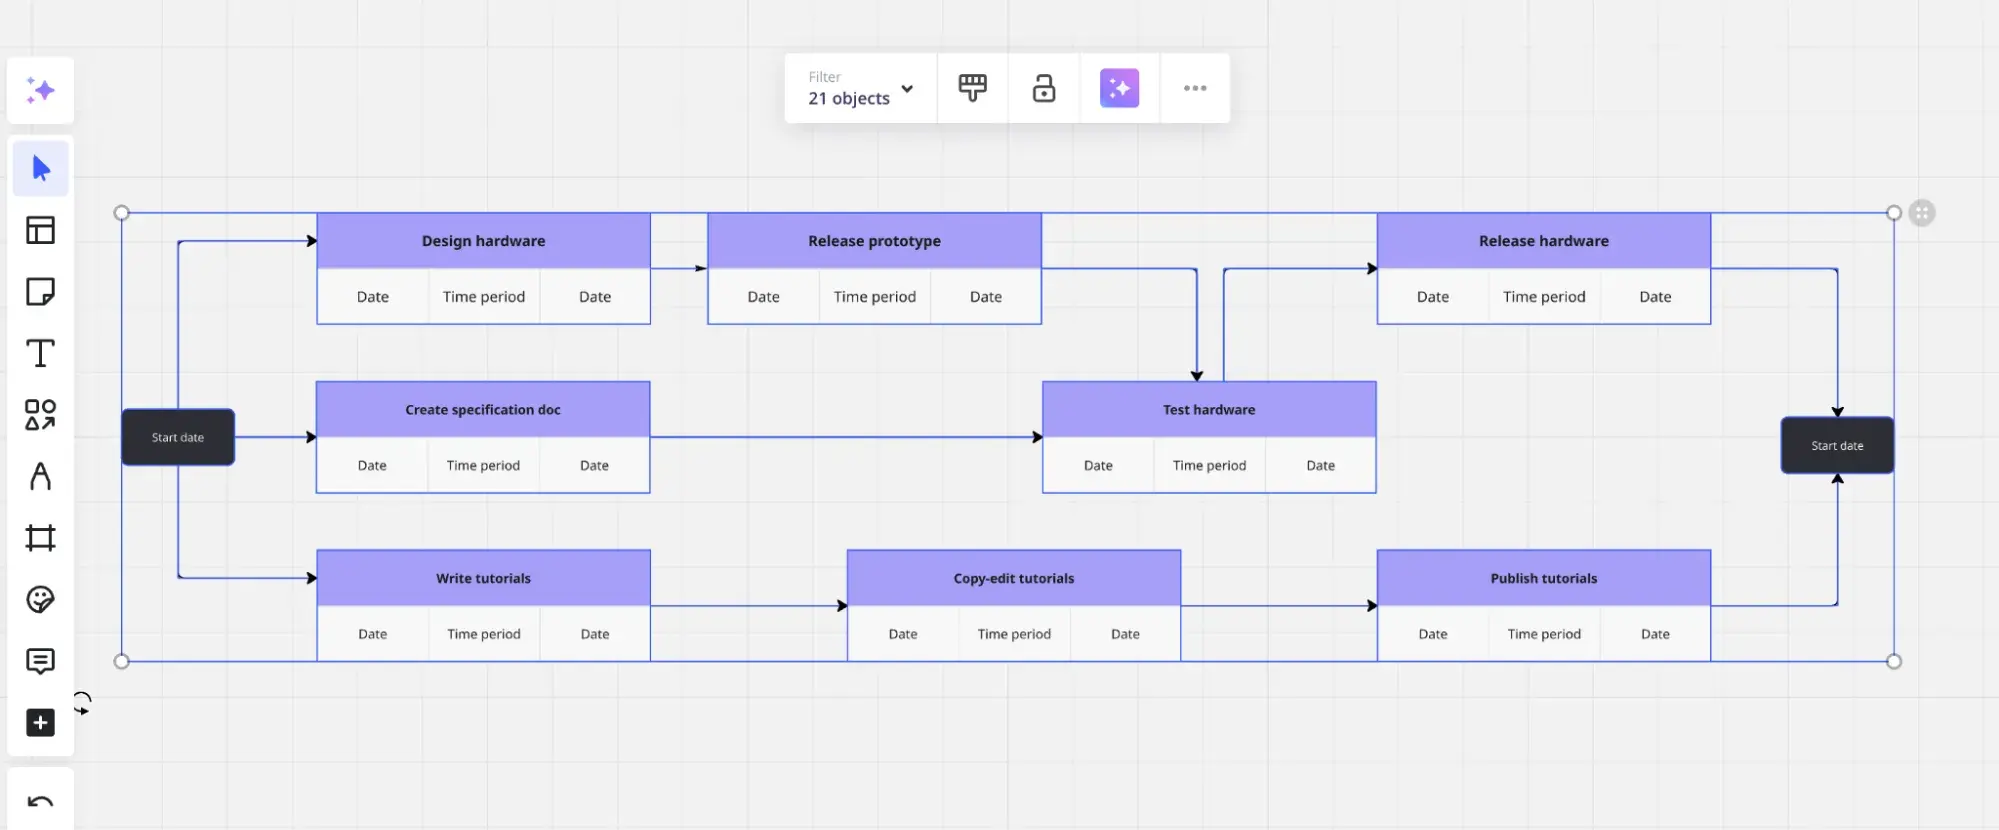
Another example is in construction. Building a house involves numerous interdependent tasks, from foundation laying to roof installation. A PERT chart can illustrate the sequence of these tasks and highlight which ones are critical. For instance, the foundation must be complete before framing can begin. This dependency is clearly shown in the chart.
Marketing campaigns also benefit from PERT analysis. A campaign launch involves multiple activities, such as content creation, social media planning, and advertising setup. Some tasks can run concurrently, while others depend on previous steps. A PERT chart helps coordinate these efforts and ensures that all components are ready for launch.
Choosing the Right Tool for PERT Charts
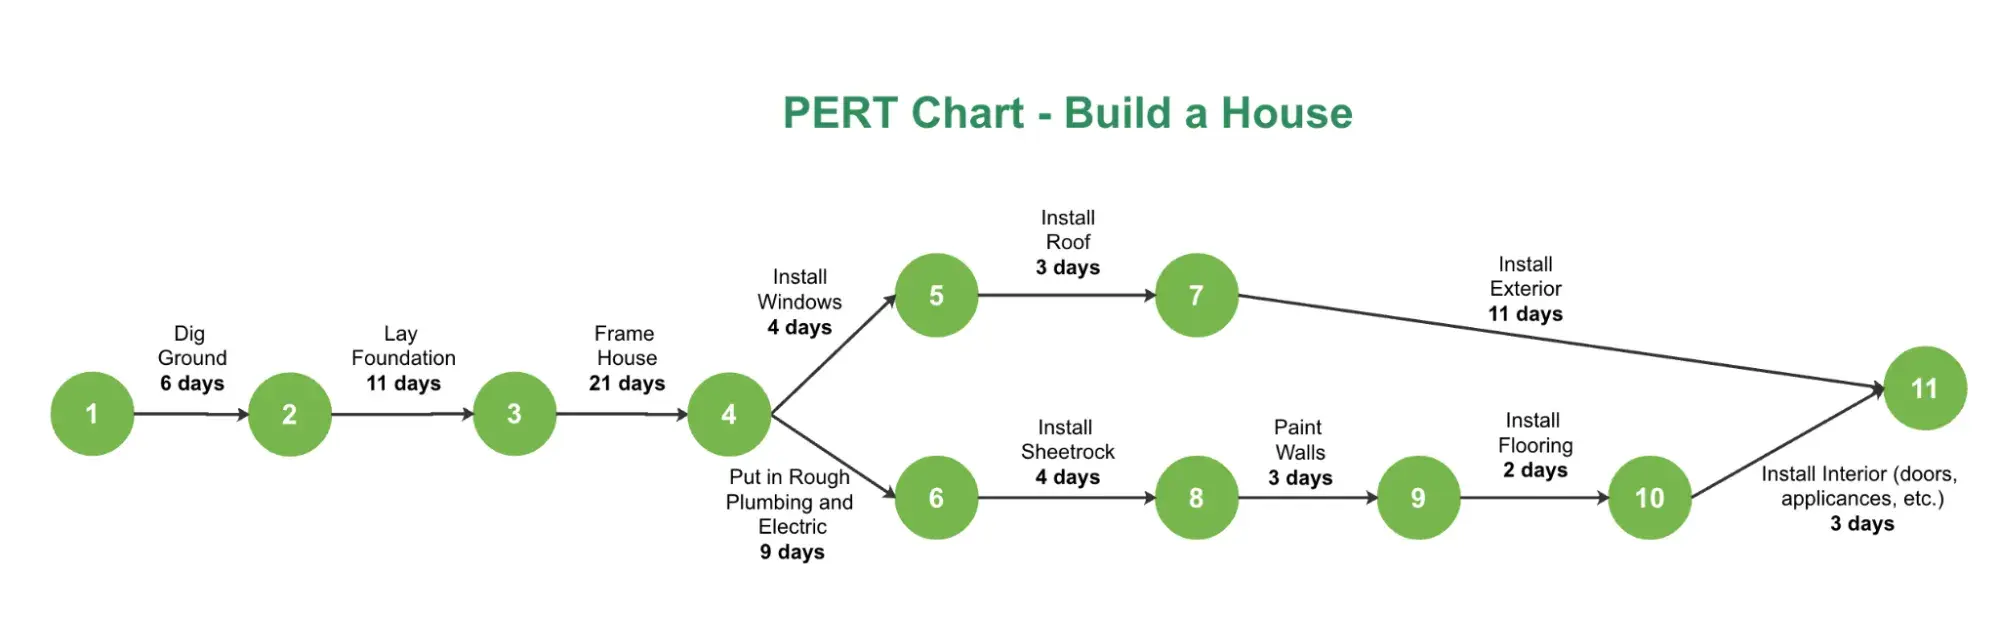
Several tools are available for creating PERT charts, each with its own strengths. Excel and Google Sheets offer simple templates that are easy to customize. They are suitable for smaller projects or teams familiar with spreadsheet software. PowerPoint and Google Slides provide visual templates that are good for presentations.
For more complex projects, specialized software like Miro or EDrawMax can be helpful. Miro offers a collaborative whiteboard environment, allowing teams to work together in real-time. EDrawMax provides advanced diagramming features, including automatic layout adjustments. Choosing the right tool depends on the project size, team collaboration needs, and technical proficiency.
Leveraging PERT for Business Efficiency and Profitability
Implementing PERT analysis can transform how a business manages projects. By providing accurate time estimates, it helps set realistic client expectations. This transparency builds trust and reduces the likelihood of disputes over delays. Clients appreciate knowing that timelines are based on a structured, probabilistic method rather than guesswork.
For service providers, accurate estimates are crucial for profitability. Overestimating can lead to underutilized resources, while underestimating can result in overtime costs and margin erosion. PERT helps strike a balance by considering best, worst, and most likely scenarios. This approach ensures that quotes are competitive yet sustainable.
Moreover, PERT encourages a proactive approach to project management. By identifying critical paths and slack time, managers can anticipate risks and plan mitigation strategies. This foresight reduces stress and improves team morale. Instead of reacting to crises, teams can focus on delivering high-quality work.
In the context of AI-driven search optimization, precise project planning is equally vital. Content creation, optimization, and distribution require coordination across multiple teams. PERT charts can map out these workflows, ensuring that each step is completed on time. This efficiency supports the broader goal of maximizing brand visibility in generative search ecosystems.
Integrating PERT with Modern Project Management Practices
While PERT is a decades-old technique, it remains relevant in modern project management. It complements agile methodologies by providing a high-level view of project dependencies. Agile teams can use PERT to plan sprints and releases, ensuring that critical features are delivered on time.
Additionally, PERT can be integrated with digital project management tools. Many platforms allow for custom fields and dependencies, enabling teams to build PERT-like charts within their existing workflows. This integration ensures that time estimates are consistently applied and tracked.
As businesses continue to face complex challenges, the ability to estimate time accurately is more important than ever. PERT offers a proven method for achieving this accuracy. By embracing its principles, organizations can improve their project outcomes, enhance client satisfaction, and drive sustainable growth.
Ultimately, the value of PERT lies in its ability to bring structure to uncertainty. It transforms vague expectations into calculated probabilities. For managers and decision-makers, this clarity is invaluable. It empowers them to make informed decisions, allocate resources effectively, and deliver projects that meet or exceed expectations. In a world where time is a scarce resource, PERT provides a roadmap for managing it wisely.





