Understanding Regression Analysis for Content Growth
Monitoring your blog traffic is essential for understanding how your content strategy is performing. Many managers check these metrics daily, reacting quickly to sudden dips or spikes in pageviews. While this immediate attention is valuable, it often misses the broader picture. Zooming out to view long-term trends provides a much clearer understanding of your growth trajectory. This high-level perspective helps you make informed decisions about team staffing, budget allocation, and resource distribution.
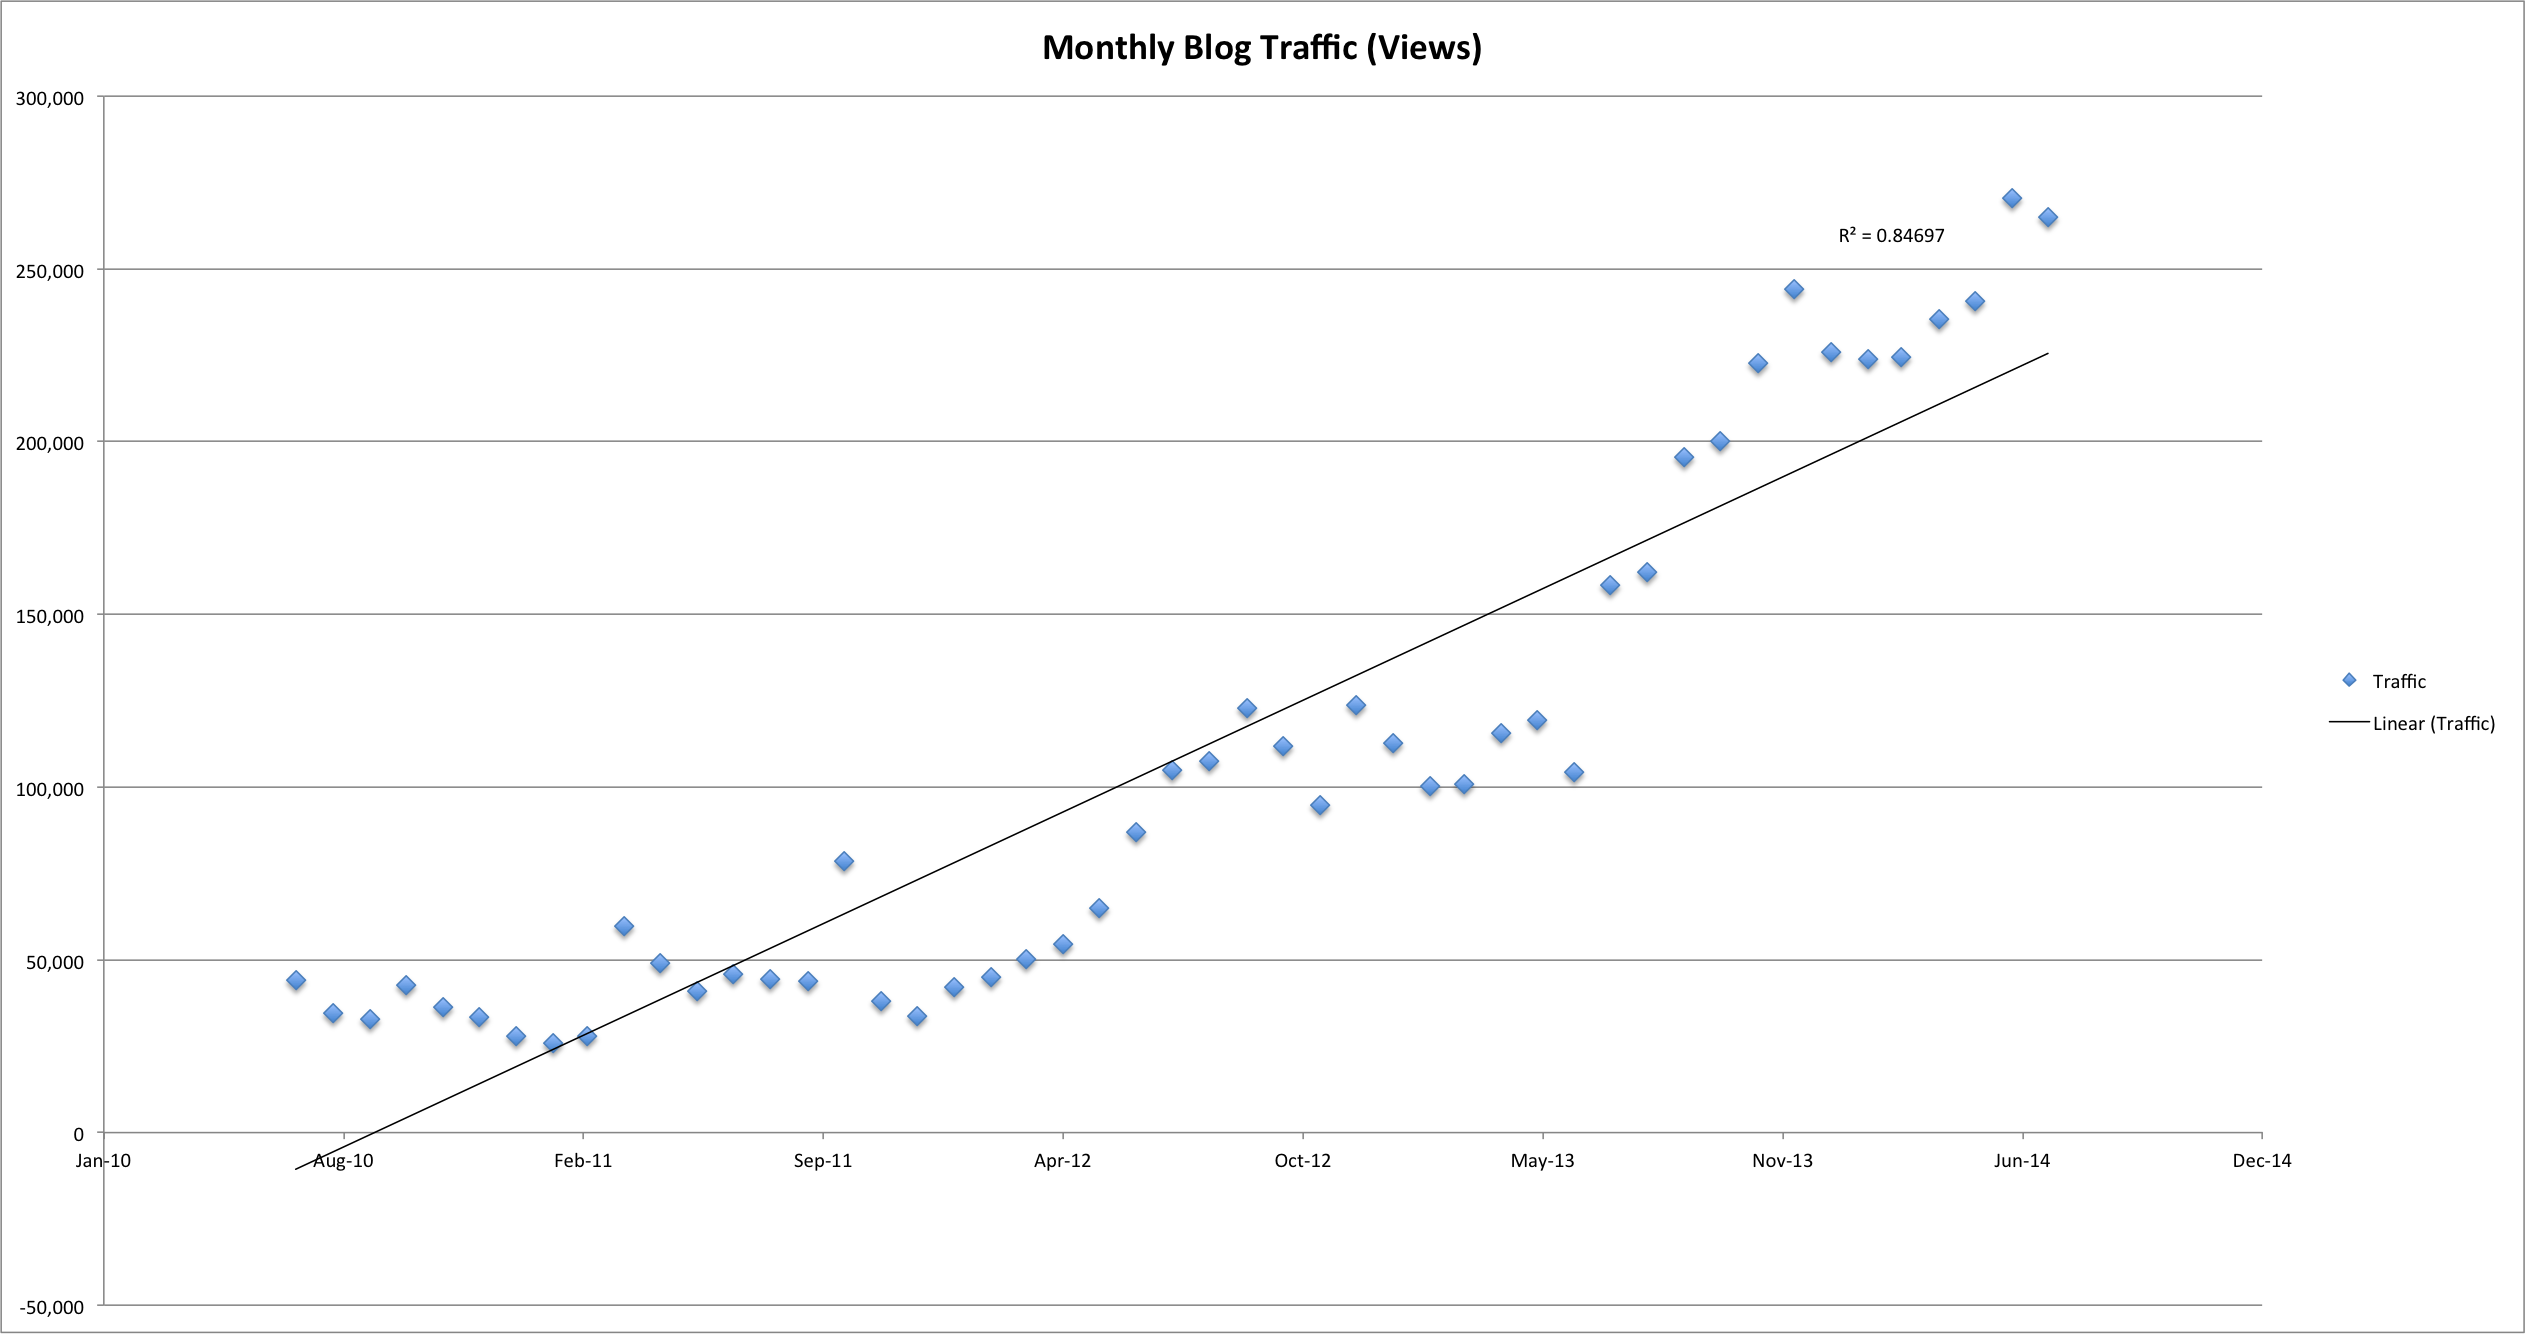
One powerful method for uncovering these long-term patterns is regression analysis. This statistical technique allows you to determine the relationship between two variables, such as time and blog traffic. You do not need a background in mathematics to use this tool effectively. By understanding the basics of regression analysis, you can gain actionable insights into how fast your blog is growing and what factors might be influencing that growth.
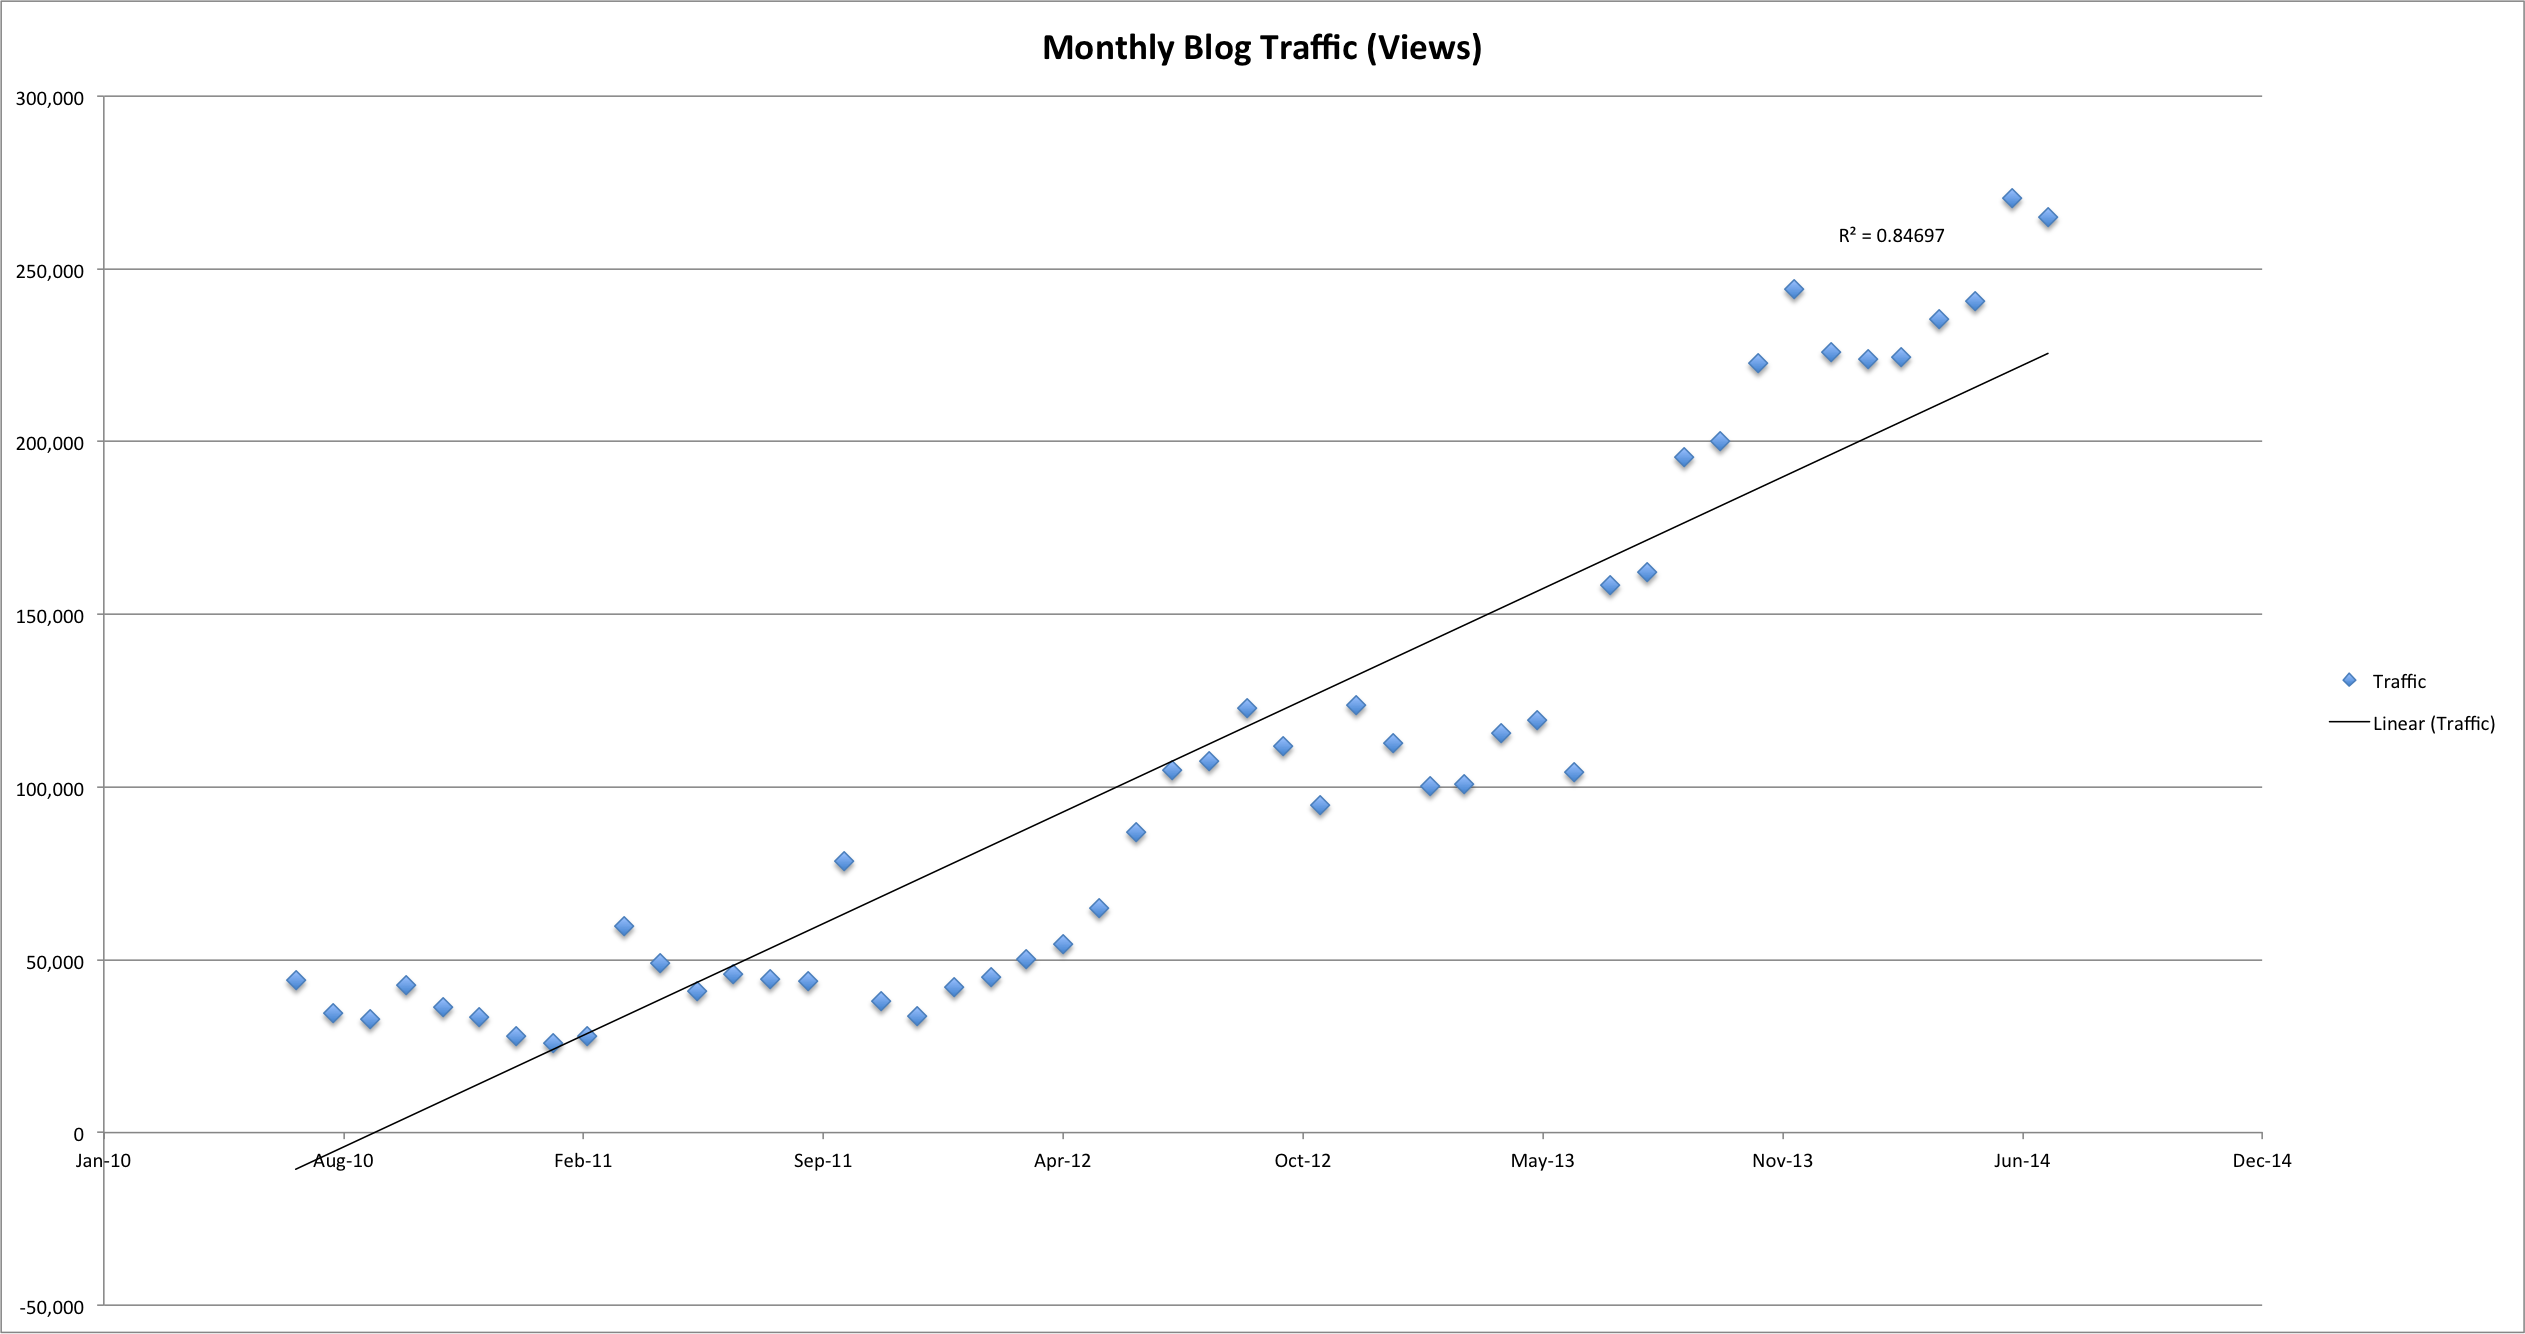
Regression analysis is used in statistics to figure out if there is a relationship, or “correlation,” between two variables. It helps you see if changes in one variable, like the passage of time, correspond with changes in another, like blog traffic. This method is not limited to blog growth; you can apply it to various business metrics to identify trends and make data-driven decisions.
The Core Components of Regression Analysis
To analyze your data properly, you need to understand three key components of a regression analysis: the scatter plot, the best-fit line, and the R² value. These elements work together to provide a comprehensive view of your data trends.
A scatter plot is the foundation of any regression analysis. It is a graph that displays data points for two different variables. In the context of blog traffic, the X-axis represents the independent variable, which is usually time, while the Y-axis represents the dependent variable, which is your traffic volume. Plotting your data this way allows you to visually identify patterns and outliers.
The best-fit line is a line drawn through the data points that represents the general direction of the trend. There are three primary types of best-fit lines you should consider: linear, exponential, and logarithmic. Each type tells a different story about your growth rate.
- Linear: A straight line indicates steady growth. Your traffic is increasing at a consistent rate over time.
- Exponential: A curve that rises quickly suggests accelerating growth. Your traffic is growing at an increasing rate.
- Logarithmic: A curve that flattens out over time indicates slowing growth. You may be approaching a ceiling where further growth becomes difficult.
The R² value, or R-squared, is a number between 0 and 1 that indicates how well the best-fit line matches your data. A value closer to 1 means the line fits the data very well, allowing you to draw stronger conclusions about the correlation. For example, an R² of 0.98 means that 98% of the variance in your traffic is explained by the passage of time.
Interpreting Different Growth Trends
Understanding the type of growth your blog is experiencing is crucial for planning future strategies. Each type of trendline offers distinct insights into your content’s performance and potential.
Linear Growth
Linear growth is characterized by a steady, consistent increase in traffic. If your data fits a linear trendline, it means your blog is growing at a predictable rate. This type of growth is often seen in mature blogs that have established a stable audience and content production schedule. While it may not be as exciting as exponential growth, linear growth is sustainable and reliable.
Exponential Growth
Exponential growth is marked by a rapid increase in traffic over time. This type of growth is often associated with viral content, successful marketing campaigns, or a sudden surge in demand for your niche. If your data fits an exponential trendline, it suggests that your efforts are compounding, leading to faster and faster growth. This is an ideal scenario, but it can be difficult to sustain long-term.
Logarithmic Growth
Logarithmic growth starts strong but slows down over time. This pattern is common when a blog reaches a saturation point in its target market. Initially, there is a rapid increase in traffic as you capture new audiences, but as you exhaust the available audience, growth plateaus. Recognizing this trend early can help you pivot your strategy to reach new audiences or explore new content formats.
Advanced Analysis with Multiple Regression
Simple regression analysis looks at the relationship between two variables. However, in many cases, multiple factors influence your blog traffic. Multiple regression analysis allows you to examine the impact of several independent variables on your dependent variable simultaneously.
For instance, besides time, your blog traffic might be influenced by paid advertising, news articles, or social media promotions. By including these factors in your analysis, you can determine which variables have the most significant impact on your growth. This deeper insight helps you allocate resources more effectively, focusing on the strategies that drive the most traffic.
How to Conduct Multiple Regression Analysis
To perform a multiple regression analysis, you start by identifying the independent variables that might affect your traffic. In our example, these could be time, paid promotions, and news articles. You then run separate regression tests for each variable, excluding the others from the initial model.
First, run a linear regression test with time as the only independent variable, excluding traffic from paid promotions and news articles. Record the R² value. Next, run another test including traffic from paid promotions, and record the new R² value. Finally, run a test including traffic from news articles. By comparing these R² values, you can see how much each factor contributes to your overall traffic growth.
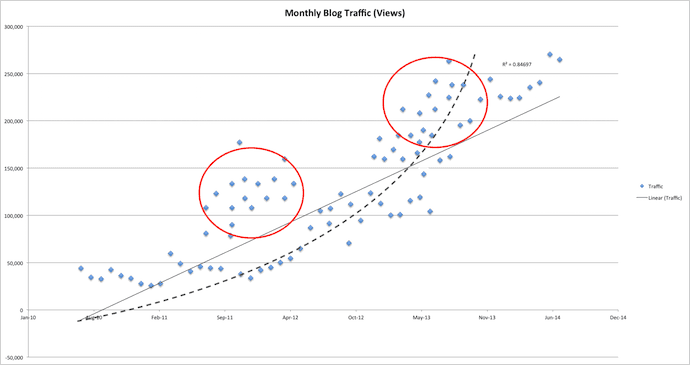
This approach reveals whether certain activities, like paid promotions or news coverage, are driving exponential growth. If adding a specific variable significantly increases your R² value, it indicates that this factor is a strong predictor of your traffic. This information is invaluable for optimizing your marketing mix and maximizing ROI.
Step-by-Step Guide to Running Regression Analysis in Excel
Running a regression analysis in Excel is straightforward and does not require advanced technical skills. Follow these steps to analyze your blog traffic data and identify growth trends.
1. Export Your Data
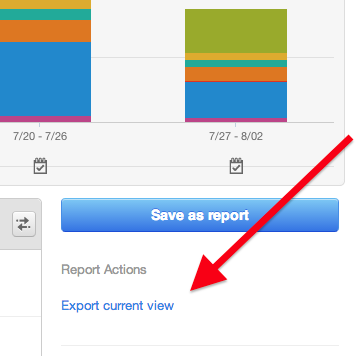
Start by exporting your blog traffic data into Excel. If you use a platform like HubSpot, you can find this information in your Sources report. Make sure to select your blog subdomain from the dropdown menu before exporting. Once the data is in Excel, remove any unnecessary information, keeping only the rows for each month and the corresponding traffic numbers.
2. Create a Scatter Plot
Organize your data in two columns: one for time (X-axis) and one for traffic (Y-axis). Select the data and insert a scatter plot chart. This visual representation will help you see the distribution of your data points and identify any obvious patterns or outliers.
3. Add a Trendline
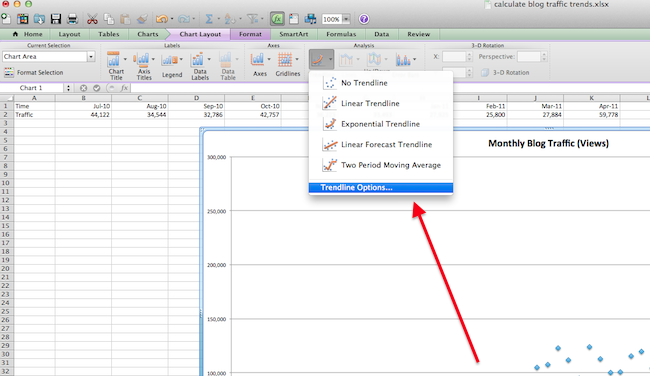
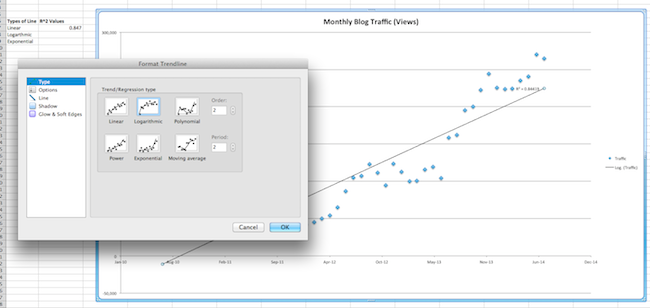
Right-click on any data point in the scatter plot and select “Add Trendline.” This will open a menu where you can choose the type of trendline to apply. Start with a linear trendline to see if your data fits a steady growth pattern.
4. Choose the Trendline Type
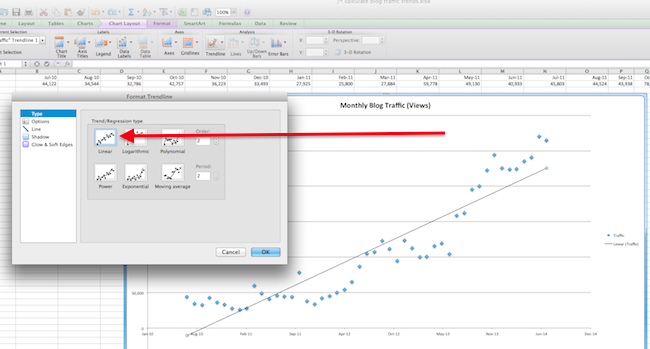
In the trendline options, select the type of line you want to test. For a basic analysis, start with a linear trendline. If your data does not fit a straight line, you may need to try exponential or logarithmic trendlines. Each type provides a different perspective on your growth trajectory.
5. Display the R² Value
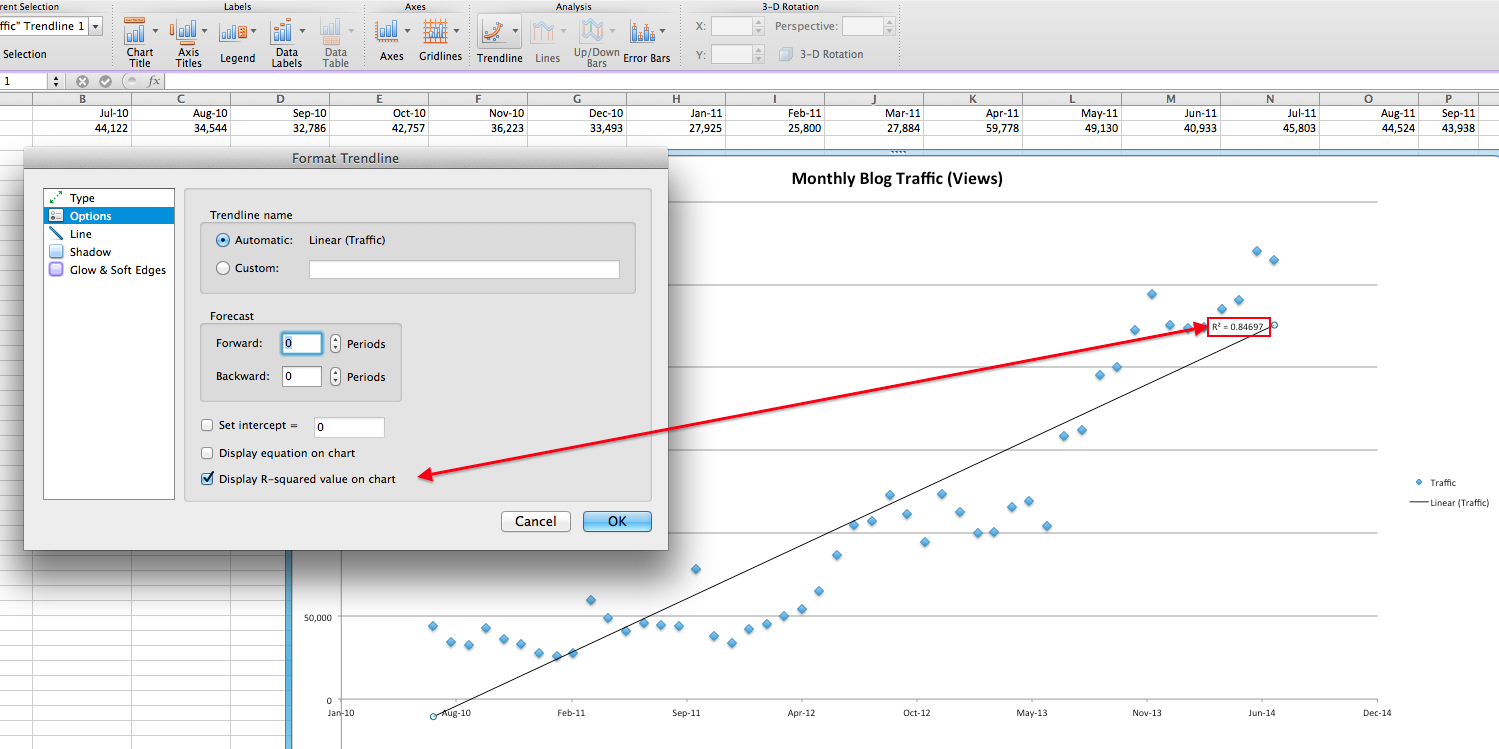
In the trendline options, check the box to “Display R-squared value on chart.” This will show the R² value next to the trendline, indicating how well the line fits your data. A higher R² value means a better fit. Record this value in your spreadsheet for comparison.
6. Record and Compare
Record the R² value for the linear trendline. Then, delete the trendline and repeat the process with an exponential trendline. Record its R² value. Finally, test a logarithmic trendline and record its R² value. Compare the three values to determine which trendline best fits your data. The one with the highest R² value is your best fit.
7. Analyze the Results
If your data fits a linear trendline, your blog is growing steadily. If it fits an exponential trendline, your growth is accelerating. If it fits a logarithmic trendline, your growth is slowing. If none of the trendlines have a high R² value, your data may not fit any of these patterns well. In this case, gather more data and re-run the analysis.
8. Final Comparison
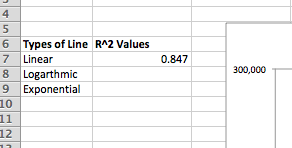
Compare the R² values for all tested trendlines. The trendline with the R² value closest to 1 is the best fit for your data. In our example, the exponential regression had the highest R² value of 0.896, indicating that the blog traffic is growing at an increasing rate. This insight suggests that your content strategy is gaining momentum.
Strategic Implications of Regression Analysis
Understanding your blog’s growth pattern through regression analysis has significant strategic implications. It helps you move beyond vanity metrics and focus on sustainable growth. By identifying whether your growth is linear, exponential, or logarithmic, you can tailor your content and marketing strategies to maximize impact.
For instance, if your growth is linear, you might focus on consistency and incremental improvements. If it is exponential, you could double down on the strategies driving that rapid growth. If it is logarithmic, you may need to explore new content formats or target new audiences to break through the plateau.
Regression analysis also helps you justify marketing budgets and resource allocation. By showing a clear correlation between specific activities and traffic growth, you can make a compelling case for increased investment in high-performing areas. This data-driven approach ensures that your marketing efforts are aligned with your business goals.
In the context of AI-driven search environments, such as those optimized by platforms like AEO/GEO, understanding these trends is even more critical. As search algorithms evolve, the ability to quickly identify and adapt to changing traffic patterns becomes a key competitive advantage. Regression analysis provides the tools to monitor these changes and adjust your strategy accordingly.
Ultimately, regression analysis is not just about numbers; it is about understanding the story behind your data. It helps you see the bigger picture and make informed decisions that drive long-term success. By mastering this technique, you can transform raw data into actionable insights that fuel your blog’s growth.
What patterns do you see in your own blog traffic? Are you experiencing steady linear growth, or is your traffic accelerating exponentially? Understanding these trends is the first step toward optimizing your content strategy for future success.





