The Mathematics Behind Sustainable Growth
Growth does not happen by accident, and it certainly does not happen by guessing. When executive leadership asks for a lead generation forecast, the answer cannot be a number pulled from thin air. It must be a projection anchored in historical data, current conversion rates, and clear revenue objectives. For marketing and sales teams to operate as a unified growth engine, the bridge between them is built on math, not intuition.
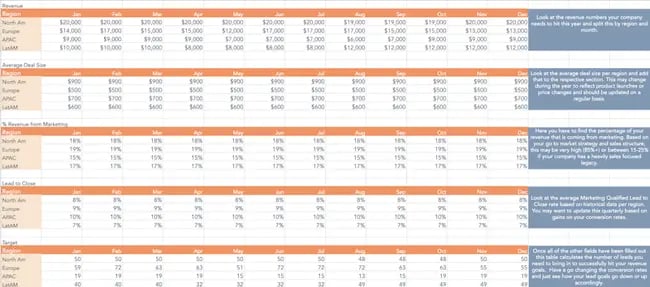
A lead generation goal is a calculated target that dictates how many potential customers your marketing efforts must attract to ensure your sales team has enough qualified opportunities to hit revenue targets. Without this calculation, you risk either under-producing leads and stalling growth, or over-producing low-quality leads that overwhelm your sales capacity. The goal is precision.
We believe that visibility in the modern search era—both traditional and generative—requires this same level of precision. Just as AEO/GEO services optimize content to answer specific questions with authority, your lead strategy must answer the question of “how many” with data. This approach transforms marketing from a cost center into a measurable revenue driver.
Why Gut Feelings Fail in B2B Marketing
Relying on historical averages without adjusting for current market conditions is a common pitfall. Markets shift, competition intensifies, and buyer behavior evolves. A goal set in January might be obsolete by March if you haven’t recalculated based on real-time performance.
By using a structured calculation method, you create a Service Level Agreement (SLA) between marketing and sales. This agreement defines what marketing owes sales (qualified leads) and what sales owes marketing (feedback on lead quality and close rates). It aligns expectations and removes the blame game that often plagues disconnected departments.
Setting the Foundation: Revenue and Deal Size
The first step in any lead calculation is working backward from the top. You must start with the revenue target your company needs to hit. This is non-negotiable. If you do not know your revenue goal, you cannot determine your lead goal. Work with your sales leadership to define the monthly or quarterly revenue targets for each region, persona, or product line.
Once you have the revenue target, you need to determine the average deal size. This figure represents the average value of a closed-won deal. It is crucial to break this down by persona or region if your customer segments vary significantly in value. For example, a small business owner might have a much smaller average contract value than an enterprise client. Inputting these distinct average sale prices into your model ensures your lead goals are realistic for each segment.
Calculating Average Deal Size Accurately
To find your average deal size, look at your CRM data from the last six to twelve months. Sum the total revenue from closed-won deals and divide by the number of deals closed.
| Metric | Description | Example Value |
|---|---|---|
| Total Revenue | Sum of all closed deals in period | $1,000,000 |
| Number of Deals | Count of closed-won opportunities | 50 |
| Average Deal Size | Total Revenue / Number of Deals | $20,000 |
If you have multiple product tiers, calculate the weighted average. This prevents skewing your data if one high-value deal distorts the mean. Regularly revisit these numbers. As your pricing changes or your market mix shifts, your average deal size will change, and your lead goals must adjust accordingly.
Understanding Conversion Rates and Pipeline Contributions
Not every lead becomes a customer. In fact, very few do. The gap between a lead and a closed deal is bridged by conversion rates. You need to understand two key metrics: the marketing-to-sales conversion rate and the sales close rate.
First, determine the percentage of revenue pipeline generated by marketing versus outbound sales efforts. In an inbound-led organization, marketing might contribute 60-80% of the pipeline. In an outbound-heavy model, that number might be lower. This split helps you isolate the portion of revenue you are responsible for driving through lead generation efforts.
Second, analyze your historical close rates. Look at the last six months of sales data. What percentage of Marketing Qualified Leads (MQLs) become Sales Qualified Leads (SQLs)? What percentage of SQLs become customers? This end-to-end conversion rate is the engine of your calculator. If your overall lead-to-customer conversion rate is 5%, you know you need 20 leads for every 1 customer.
The Impact of Channel-Specific Performance
Conversion rates are not uniform across all channels. Leads from organic search might convert at 10%, while leads from paid social might convert at 2%. Using a blended average can mask inefficiencies. By calculating goals by channel, you can allocate budget and effort to the highest-performing sources. This granular view allows you to optimize your mix rather than treating all leads as equal.
Using the Lead Goal Calculator Step-by-Step
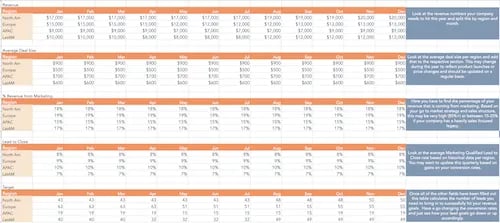
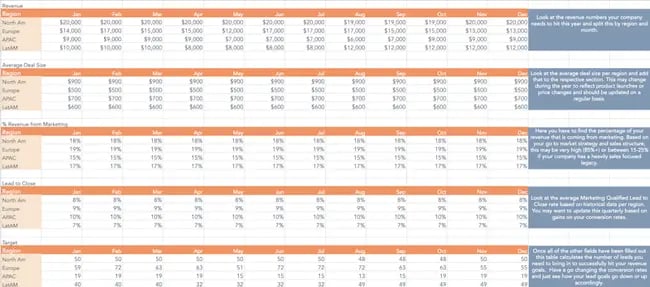
A lead goal calculator is a tool that automates this backward calculation. It takes your revenue target, average deal size, and conversion rates to output the number of leads required per month. Here is how to use it effectively.
Step 1: Input Revenue Targets
Enter your monthly revenue goal for each region or persona. If your annual goal is $1.2 million, your monthly target is $100,000. Ensure this number aligns with sales leadership. Discrepancies here will derail the entire model.
Step 2: Enter Average Deal Size
Input the average sale price for each segment. If your enterprise segment averages $50,000 and your SMB segment averages $10,000, keep them separate. This allows for more accurate forecasting.
Step 3: Define Marketing’s Contribution
Specify the percentage of revenue that comes from marketing-generated pipeline. If marketing is responsible for 70% of new business, the calculator will focus on generating enough leads to cover that 70% slice of the revenue pie.
Step 4: Apply Historical Close Rates
Input your lead-to-close conversion rate. This should be based on actual performance data, not aspirational targets. If your historical rate is 4%, use 4%. Optimism here leads to under-forecasting leads and missing revenue goals.
Step 5: Review and Commit
The calculator will sum up the required leads across all channels and personas. This total is your monthly commitment. It is the number you must hit to stay on track. Update this spreadsheet monthly as performance data shifts.

Tracking Performance Against Plan
Calculating the goal is only half the battle. The other half is tracking your progress against that goal. The “Performance Against Plan” tab in your calculator serves as a dashboard for accountability. It allows you to input actual lead volumes daily or weekly and compare them to the target.
This visibility is critical for mid-month adjustments. If you are behind target by week three, you can identify which channels are underperforming and reallocate resources. Perhaps your email campaign is lagging, but your social media efforts are ahead. You can double down on what works and troubleshoot what doesn’t.
The Power of Daily Monitoring
Top-performing marketing teams monitor these numbers daily. Waiting until the end of the month to check performance is too late to make changes. By tracking daily, you create a feedback loop that keeps the team aligned and responsive. Send a weekly summary to sales leadership to maintain transparency and trust.
Channel-Specific Lead Goals
A holistic lead goal is useful, but channel-specific goals are actionable. Breaking down your total lead requirement by source—social media, website, email, search—helps you assign responsibility and measure ROI for each tactic.
Social Media Lead Goals
Social media is often a top-of-funnel channel. It may generate a high volume of leads but with a lower conversion rate. Use your calculator to determine how many social leads you need to contribute to the overall goal. Track the revenue attributed to social media to ensure the volume justifies the effort. If social leads convert at 2%, you need five times as many social leads as website leads to generate the same revenue.
Website and Organic Search Goals
Website traffic, particularly from organic search, often yields higher-quality leads. These users are actively seeking solutions. Calculate how many website visitors you need to convert into leads to meet your target. This involves optimizing landing pages, improving site speed, and ensuring your content answers user intent. In the context of AEO/GEO, ensuring your content is structured to be picked up by AI search engines can significantly boost the quality and volume of these organic leads.
Email Marketing Goals
Email is a powerful nurture channel. It may not generate new leads as frequently as social media, but it often has a higher conversion rate among existing subscribers. Determine what percentage of your revenue should come from email marketing. Calculate how many new opt-ins you need each month to sustain that revenue stream. This involves balancing acquisition with retention.
Experimenting with Scenarios
A lead goal calculator is not just a tracking tool; it is a planning tool. Use it to run scenarios. What happens to your lead goal if you increase your average deal size by 10%? What if you improve your conversion rate by 1%? These “what-if” analyses help you prioritize initiatives.
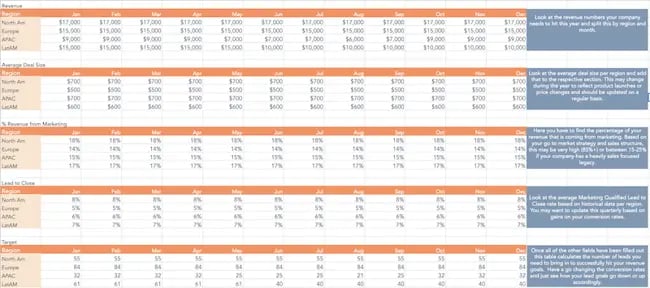
Improving conversion rates often has a more significant impact on revenue than increasing lead volume. If you can convert 10% more leads without spending more on acquisition, you save money and increase profit. Use the calculator to demonstrate the ROI of optimization projects to stakeholders.
Aligning Sales and Marketing for Success
The ultimate goal of calculating lead generation goals is alignment. When sales and marketing share a single source of truth—a spreadsheet grounded in data—they speak the same language. Marketing understands the volume and quality of leads sales needs. Sales understands the effort and resources marketing requires to generate those leads.
This alignment reduces friction and accelerates growth. It transforms the relationship from adversarial to collaborative. Both teams are rowing in the same direction, toward the same revenue target.
The Role of Feedback Loops
Regular communication is essential. Sales must provide feedback on lead quality. If a large portion of leads are not a good fit, marketing needs to adjust targeting and messaging. Marketing must share performance data with sales to set expectations. This continuous loop of feedback and adjustment ensures that your lead goals remain relevant and achievable.
Conclusion: Data-Driven Decisions
Calculating your lead generation goals is a fundamental practice for any growth-focused business. It moves you away from guesswork and toward precision. By understanding your revenue targets, average deal sizes, and conversion rates, you can determine exactly how many leads you need to generate each month.
Use a calculator to automate the math and track your performance against plan. Break down your goals by channel to optimize your mix. Experiment with scenarios to identify high-impact opportunities. And most importantly, align with sales to ensure you are both working toward the same objective. In a world where visibility and conversion are paramount, data is your most valuable asset.
What is your current lead-to-customer conversion rate, and how often do you recalculate your goals?





