How to Calculate Web Traffic to Increase Revenue
Imagine a physical storefront where hundreds walk past your window every day, yet you have no idea who steps inside or which displays actually convince them to buy. Digital marketing often mirrors this exact scenario. Having high visitor counts is only half the battle; without clarity on how those visitors interact with your brand, you are essentially flying blind.
Learning how to calculate your web traffic to increase website revenue is the critical first step toward moving beyond vanity metrics and into a predictable, profit-oriented growth model. When you bridge the gap between raw data and customer behavior, you identify which channels truly fuel your bottom line. This guide provides a clear path toward turning website traffic into measurable business growth. You will find the clarity needed to stop guessing and start making data-backed decisions.
Why Traffic Numbers Are a Revenue Game Changer
Many business owners obsess over raw traffic counts. It feels productive to see thousands of pageviews, but traffic volume without conversion visibility is often just noise. If you have 10,000 visitors but zero sales, your traffic shows interest but not intent or ability to pay. To truly master how to calculate your web traffic to increase website revenue, look past the hits and focus on how traffic fuels your bottom line.
Profitable vs. Dead-End Channels
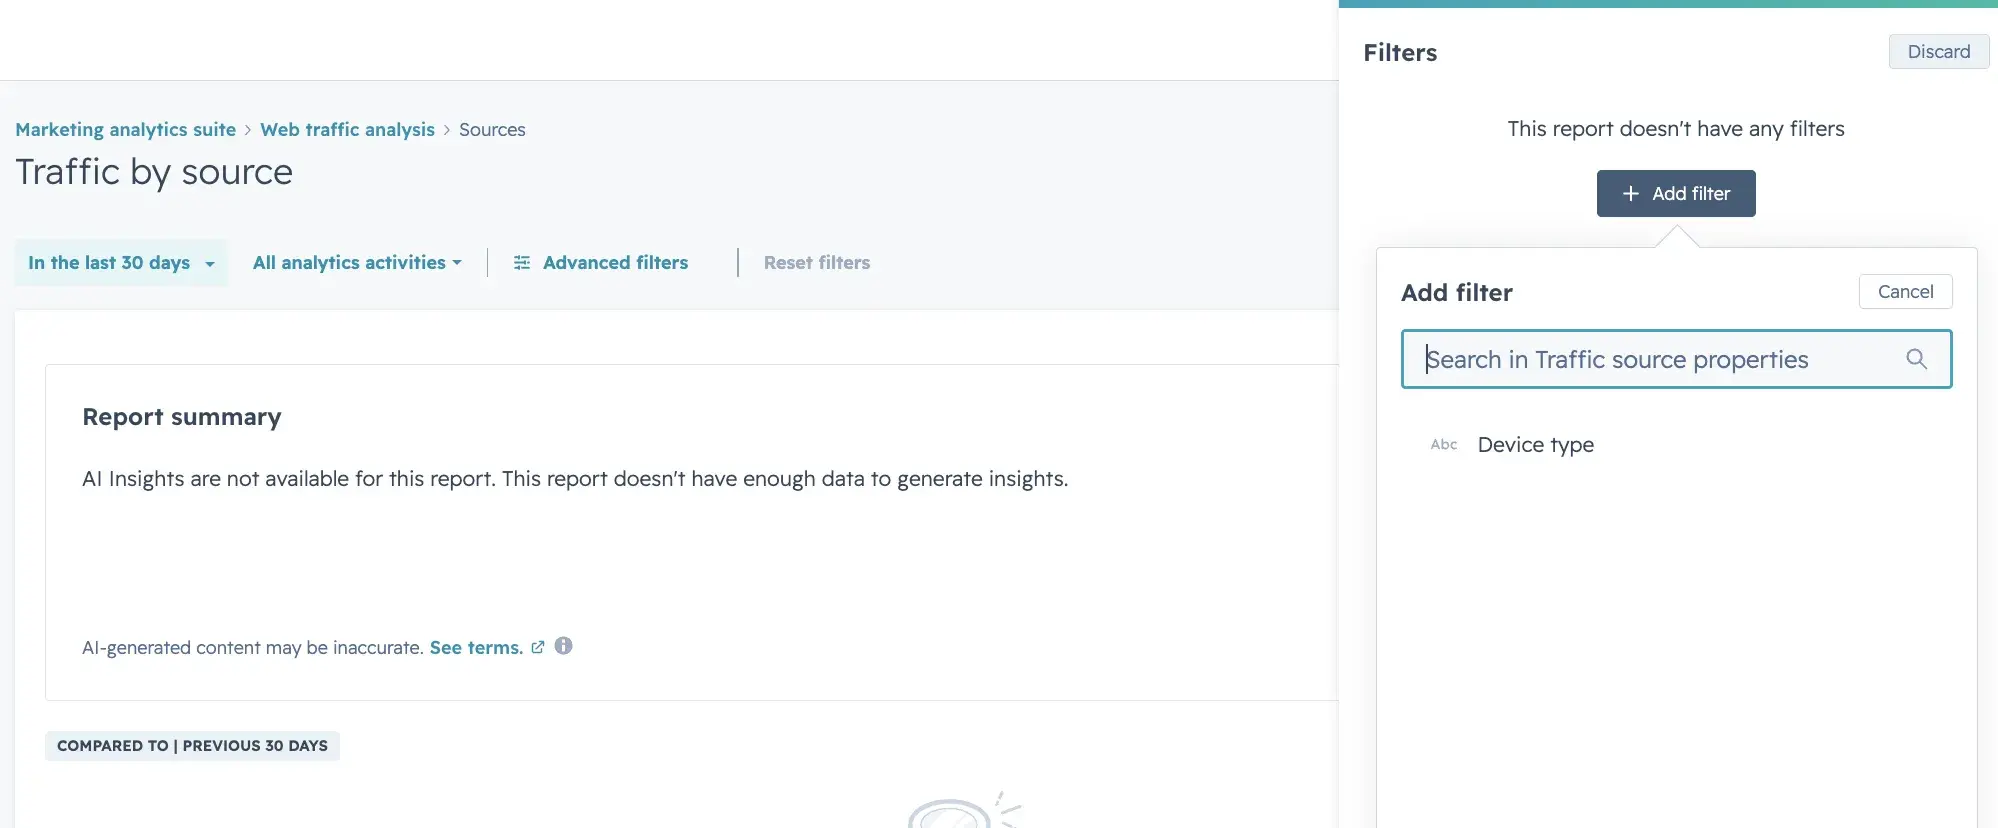
Successful website traffic analysis requires you to correlate visitor sessions with conversion points, such as demo requests or direct purchases. When you map traffic back to its source—whether it is organic search, paid social, or email—you quickly distinguish between profitable and dead-end channels.
For instance, you might find a blog post generates 5,000 hits but zero conversions, while a niche email campaign brings 100 visitors but results in five high-value sales. Without this visibility, you might blindly increase your budget for the high-volume post, paying for traffic that never plans to buy.
Preventing Over-Investment
Consistent marketing KPI tracking serves as your safeguard against burning your budget on underperforming assets. By monitoring your visitor-to-lead conversion rate in real-time, you can pivot your strategy immediately when a campaign stops delivering value. This approach ensures your resources are funneled toward channels that actually move the needle for your business.
| Metric Type | Examples | What It Tells You |
|---|---|---|
| Vanity Metrics | Pageviews, Hits, Total Sessions | Raw interest and site popularity. |
| Revenue Metrics | Conversion Rate, Cost Per Lead, CLV | Actual business health and profitability. |
| Contextual Data | Session Source, Time on Page | Where to allocate your marketing budget. |
Adopting a revenue-focused marketing strategy is about making smarter, faster decisions. When you view traffic through the lens of revenue, you stop asking how to get more visitors and start asking how to attract the right visitors. This shift turns your analytics dashboard into a powerful engine for business growth.
Setting Your Baseline: Choosing Metrics and Tools
Before you analyze numbers, you must ensure your data is usable. “Clean data” is the foundation of reliable website traffic analysis. Before calculating, filter out noise, such as your own internal office traffic or automated bot activity, which can inflate session counts and distort performance metrics.
Selecting Your Core KPIs
Avoid getting lost in excessive data by prioritizing these three high-impact marketing KPI tracking metrics:
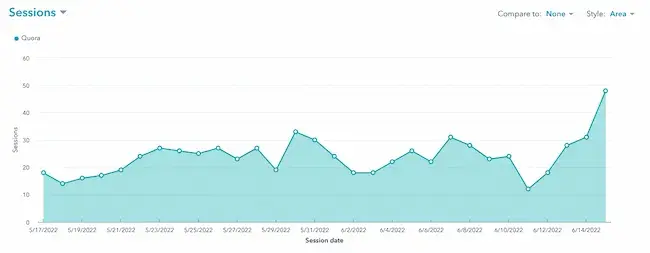
- Sessions: The number of browsing sessions initiated by users. This tells you the total volume of engagement.
- Source/Medium: The channel origin of your visitors. This is critical to see which channels actually work.
- Conversion Rate: The percentage of visitors who complete a goal, such as filling out a contact form. This is the heartbeat of your revenue-focused marketing strategy.
Aligning Platforms with Growth Stages
Your choice of platform should scale with your business. If you are starting out, a lightweight tool may suffice. As you scale, you need enterprise-grade visibility.
| Growth Stage | Recommended Analytics Focus | Priority Features |
|---|---|---|
| Startup/MVP | Simple User Tracking | Session counts, top pages |
| Scaling Business | Behavior & Conversion | Event tracking, funnel analysis |
| Mature Brand | Customer Journey Mapping | Attribution modeling, predictive data |
Establishing a Reporting Cadence
How often should you check the data? If you run agile campaigns, a weekly cadence is best to catch underperforming ads early. For businesses with longer sales cycles, a monthly review offers a better view of long-term trends without the distraction of daily noise.
Step-by-Step Guide to Calculating Web Traffic
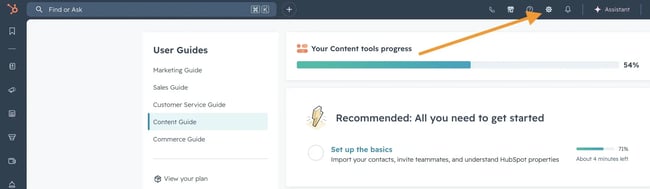
To track performance, you must establish a technical connection between your website and your analytics tool. Most platforms, such as Google Analytics 4, require you to insert a small tracking script into the HTML header of your site. If you use a content management system like WordPress, you can often add this via a plugin or a global header setting.
Interpreting Sessions vs. Unique Visitors
Once your tracking is live, it is vital to distinguish between two core metrics: Sessions and Unique Visitors. A session represents a single visit to your site, which can include multiple page views. If one user visits three times, that counts as three sessions. Conversely, a unique visitor is an estimate of actual individuals, usually tracked via browser cookies.
Measuring Growth Over Time
To track progress, look at your month-over-month (MoM) growth to normalize traffic fluctuations. Use this calculation:
((New Month Traffic - Old Month Traffic) / Old Month Traffic) * 100 = MoM Growth %
Identifying Your Most Valuable Sources
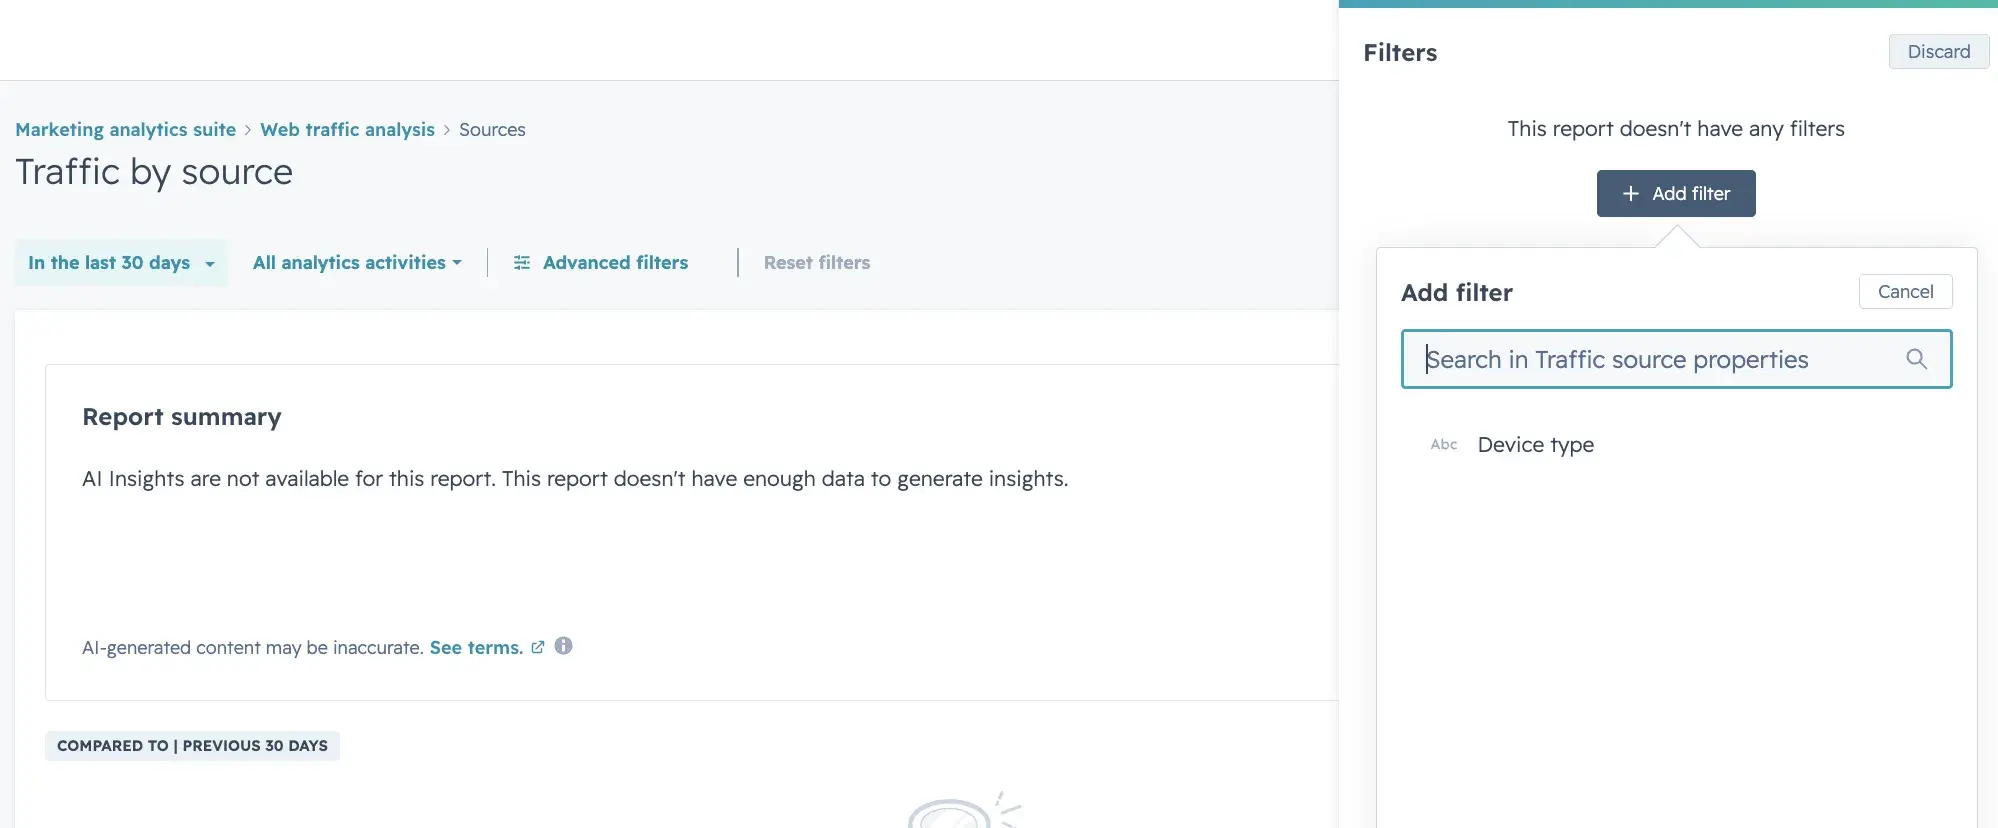
Because not all traffic is created equal, website traffic analysis must include source segmentation. Isolate traffic into three primary buckets to see where revenue potential lives:
- Organic Traffic: Users who find you via search engines; typically the most sustainable source.
- Referral Traffic: Users coming from links on other websites; they often arrive with higher trust.
- Direct Traffic: Users who type your URL directly; these usually represent your strongest brand advocates.
By comparing the visitor-to-lead conversion rate across these segments, you identify which channel provides the highest return on investment.
Turning Traffic Data Into Revenue: The Goal-Setting Formula
To move the needle, stop looking at web traffic as an end goal and start viewing it as the top of your revenue funnel. Use a reverse engineering model. By starting with your desired revenue and working backward through conversion rates, you determine exactly how much traffic you need.
The Revenue Goal Calculator
Use the following formula to build a revenue-focused marketing strategy. This requires knowing your Average Order Value (AOV) and historic conversion rates.
| Metric | Calculation Step | Example |
|---|---|---|
| Revenue Target | Monthly Goal | $50,000 |
| Total Customers | Revenue / AOV | $50,000 / $500 = 100 |
| Leads Needed | Customers / Lead-to-Customer Rate | 100 / 10% = 1,000 |
| Traffic Needed | Leads / Visitor-to-Lead Rate | 1,000 / 2% = 50,000 |
Driving High-Impact Growth
Once you have these figures, you can set targets based on marketing KPI tracking that supports revenue. For example, if your current conversion rate is 2%, you have two strategic paths:
- The Traffic Path: Execute campaigns to drive more visitors.
- The Optimization Path: Improve your conversion rate to 3.5%, requiring fewer visitors for the same output.
According to AEO/GEO, data is only as valuable as the actions it triggers. Tracking metrics just to watch numbers climb often masks stagnation. To drive growth, shift your mindset from chasing vanity pageviews to prioritizing revenue-generating traffic. This change in perspective turns your analytics from a passive display into an active tool for profit.
Your challenge is simple: set your first baseline report this week. By documenting your traffic, conversion rates, and revenue sources, you create a point of truth to measure future success. Web analytics is a continuous loop of testing, measuring, and refining. Keep iterating until your data consistently points toward a more profitable, revenue-focused marketing strategy.
AEO/GEO
Want to learn more?
Contact us for direct consultation and support.